DATA
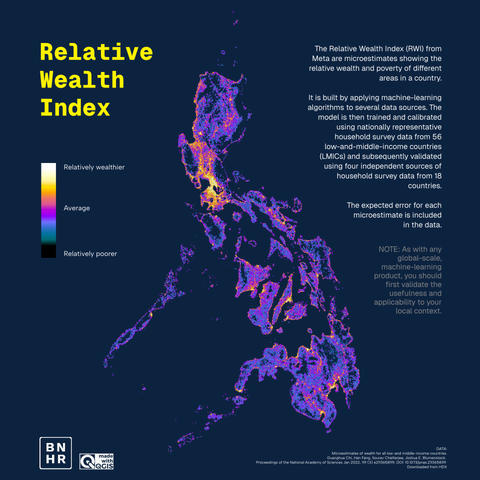
> Relative Wealth Index (https://data.humdata.org/dataset/relative-wealth-index)

PROCESS
1. Load the RWI point layer for the Philippines.
2. Style the layer as square markers—size: 2400 meters at scale; color: ramp of your choice.

#30DayMapChallenge #30DayMapChallenge2024 #Day8 #HDX #MadeWithQGIS #QGIS #FOSS4G #GISChat #Wealth #Poverty #RelativeWealthIndex #Meta

Relative Wealth Index - Humanitarian Data Exchange

30 DAY MAP CHALLENGE 2024 | DAY 8 - DATA:HDX

Relative Wealth Index

The Relative Wealth Index (RWI) from Meta are microestimates showing the relative wealth and poverty of different areas in a country.

IMPORTANT: As with any global-scale, machine-learning product, you should first validate the usefulness and applicability to your local context.

#30DayMapChallenge #30DayMapChallenge2024 #Day8 #HDX #MadeWithQGIS #QGIS #FOSS4G #GISChat #Wealth #Poverty #RelativeWealthIndex #Meta

30 DAY MAP CHALLENGE 2024 | DAY 6 - RASTER
Albay at different resolutions (100m, 500m, 1000m, 5000m)

DATA
> Any Digital Elevation Model (DEM)

PROCESS
1. Resample the DEM into 100, 500, 1000, 5000m meter pixel sizes (e.g. using Warp (Reproject) algorithm)
2. Create polygon boundaries for each resampled DEM using Polygonize (raster to vector) and Dissolve.
3. Style #2 accordingly

...

#30DayMapChallenge #30DayMapChallenge2024 #Day6 #Raster #MadeWithQGIS #QGIS #FOSS4G #Albay

...

DATA
> TomTom 2023 Traffic Index (https://www.tomtom.com/traffic-index/ranking/)
> DPWH RBI (for the roads) | You can also use OpenStreetMap

PROCESS
1. Style the main EDSA road differently from the other roads.
2. Add information in the Print Layout.
3. Utilize the Print Layout's ability to render text as HTML to style the texts.

...

#30DayMapChallenge #30DayMapChallenge2024 #Day5 #Journey #MadeWithQGIS #QGIS #FOSS4G #TomTom #Traffic #Philippines #WorstTrafficInTheWorld #CommuterNaman
#KomyuterNaman

Traffic Index ranking | TomTom Traffic Index

"Ranking travel times across 501 cities worldwide. Check out the most congested cities in the world."

Traffic Index ranking | TomTom Traffic Index

...

But maybe we can start by shifting away from car-centric designs, investing in safe and efficient public transport, creating spaces for walking and cycling, and putting people at the heart of urban planning.

...

#30DayMapChallenge #30DayMapChallenge2024 #Day5 #Journey #MadeWithQGIS #QGIS #FOSS4G #TomTom #Traffic #Philippines #WorstTrafficInTheWorld #CommuterNaman
#KomyuterNaman

...

Every person on the road lost an average of 117 hours (~5 days) waiting in traffic [2] during rush hour over the course of the year [3].

Traffic is a wicked problem—so complex and intertwined that finding a single, definitive solution is virtually impossible.

...

#30DayMapChallenge #30DayMapChallenge2024 #Day5 #Journey #MadeWithQGIS #QGIS #FOSS4G #TomTom #Traffic #Philippines #WorstTrafficInTheWorld #CommuterNaman
#KomyuterNaman

30 DAY MAP CHALLENGE 2024 | DAY 5 - JOURNEY

BYAHENG MAYNILA (loosely translated: Manila Trip/Journey)

In TomTom's 2023 Traffic Index, the Manila metro area [1] ranked the worst among 387 cities with an average travel time of 25 mins 30 secs per 10 kilometers.

...

#30DayMapChallenge #30DayMapChallenge2024 #Day5 #Journey #MadeWithQGIS #QGIS #FOSS4G #TomTom #Traffic #Philippines #WorstTrafficInTheWorld #CommuterNaman
#KomyuterNaman

NOTE
1. The flood hazard data has invalid geometries/features. You can resolve this by fixing the geometries (takes a long time) or simply disabling the Invalid features filtering in QGIS processing settings.
2. Some areas have no flood hazard features. These are marked as NO DATA in the maps.

#30DayMapChallenge #30DayMapChallenge2024 #Day4 #Hexagons #MadeWithQGIS #QGIS #FOSS4G #Kontur #UPRI #Flood #NCR #Albay #Cebu #Pangasinan

...
3. Generate centroids from the output of #2 (either using the Centroids algorithm or Geometry generators).
4. To speed up and automate the process, I created a model that runs steps 1-3 above.
5. Style the output of 3 using: marker = hexagon, size = depends on population, color = depends on hazard level (Var). Utilize data-defined overrides/Assistant.

#30DayMapChallenge #30DayMapChallenge2024 #Day4 #Hexagons #MadeWithQGIS #QGIS #FOSS4G #Kontur #UPRI #Flood #NCR #Albay #Cebu #Pangasinan

PROCESS
1. Use the "Sort" algorithm to create an ordered version of the flood hazard layer such that the features with high hazard level (3) will always be the first feature that will be matched in #2 below.
2. Run a "Join attributes by Location" between the population hex grid layer and the sorted/ordered flood hazard layer (output of #1).
...

#30DayMapChallenge #30DayMapChallenge2024 #Day4 #Hexagons #MadeWithQGIS #QGIS #FOSS4G #Kontur #UPRI #Flood #NCR #Albay #Cebu #Pangasinan