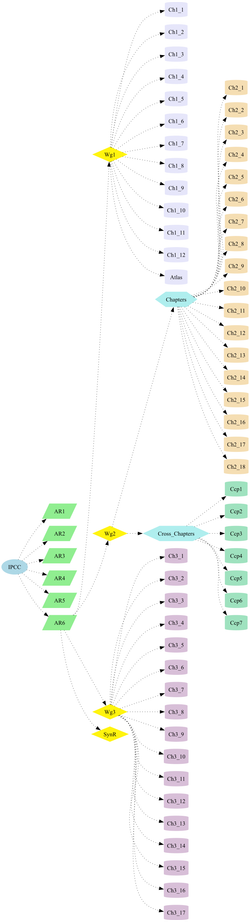
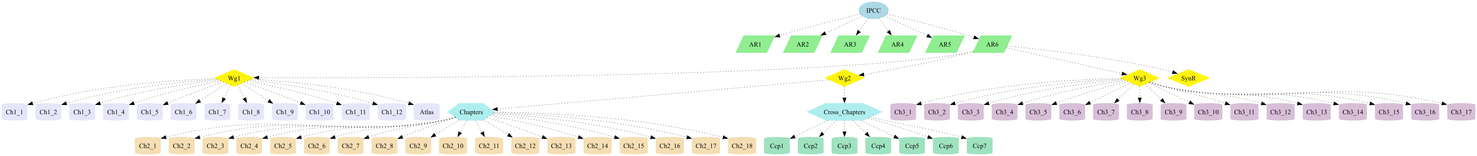
@doctormo I looked this up a few weeks back, and came up with #gnuplot #youplot and #dot. The last one is a file type which you basically have automatically. #Graphvis uses it to make up charts and whatnot.

I haven't gotten around to trying any of it out yet.

🧡 3/9 Next is a Report top level data structure: Table of Contents (Visualisation) of AR6 70 chapters. Status #Alpha - the chapters of Sixth Assessment Report β€” IPCC. Using #graphvis in Python the chapters and their connections are automatically mapped #semanticClimate #ClimateKG https://github.com/semanticClimate/internship_sC/tree/MEBIN/TOC The TOC structure is designed to provide a clear and hierarchical representation of report sections, including chapters, glossaries, supplemental materials, and cross-chapter references.
internship_sC/TOC at MEBIN Β· semanticClimate/internship_sC

Contribute to semanticClimate/internship_sC development by creating an account on GitHub.

GitHub

Man tools like graphviz, plantuml, mermaid, kroki, and similar text-based diagramming tools have such awesome potential... if only they fixed a handful of issues they might actually be usable on larger or more complex graphs... as it stands you waste most of your time trying to layout things "suggestively".

#PlantUML #Mermaid #Kroki #GraphVis