Global CO2 emissions from fossil fuels are likely to increase this year, while those from land-use change will fall.
Have global carbon emissions gone up or down this year?
The latest projections from the Global Carbon Project give us some insight. Their researchers and analysts do invaluable work estimating greenhouse gas emissions worldwide, helping us understand how the situation is evolving.
#CarbonEmissions #Carbon #CarbonDioxide #CO2 #GlobalCarbonProject #COP30
Have global carbon emissions gone up or down this year? The latest projections from the Global Carbon Project give us some insight. Their researchers and analysts do invaluable work estimating …
Die #Tagesschau berichtet auch:
https://www.tagesschau.de/wissen/klima/co2-emmissionen-100.html
Laut dem Bericht des #GlobalCarbonProject wird der Höhepunkt der Emissionen noch immer nicht erreicht – ein ernüchterndes Signal für die #Klimaziele.
Um das Pariser 1,5-Grad-Ziel zu halten, müsste der #CO2Ausstoß jährlich um 1,6 Gigatonnen sinken. Während technologische Methoden zur CO₂-Entnahme bisher nur marginal beitragen, bleibt der Schutz und Ausbau natürlicher #CO2Senken entscheidend.
Good article on the preprint (still) by parts of the team #GlobalCarbonProject how the land carbon sink 2023 net absorbed no CO2 https://www.theguardian.com/environment/2024/oct/14/nature-carbon-sink-collapse-global-heating-models-emissions-targets-evidence-aoe
It links to several other papers as well, regarding shrinking ocean's ability to help us.
And it emphasizes the necessary point:
the custom allowed by the Paris agreement, to balance emissions with "national" sinks, is not grounded in the scientific understanding of how things work. It was always the model result that sinks eventually stop helping us. And now that land and ocean show signs of succumbing to our abuse earlier than modelled, the custom is exposed earlier as the illusion it always was.
****
So the creative accounting allowed in the Paris agreement must have been squeezed in there by mainstream economists, I bet.
Maybe, Finland, who wanted to achieve net zero by 2035 simply by expanding their "national" sink instead of doing the hard work in getting emissions to zero,
can pay her way out of the quagmire: take a country from Global South 3 times its own population and make it CO2zero by 2035 by paying for factories and education to manufacture and install wind power and PV with batteries. This way, one country becomesCO2zero by 2035 and increases its resillience against climate disasters by lifting more people out of poverty. Becoming indepemdent from fossil imports and getting clean cooking fuel to everyone also helps the country's government budget. And the factories can be used to ship turbines and PV to the broader region.
Oh shit.
The team of the Global Carbon Project did a rapid analysis for all-time record year-on-year CO2 growth in 2023: #GlobalCarbonProject
https://arxiv.org/abs/2407.12447 (preprint)
From the thread on Twix by one of the authors:
" 🚨 Collapse of the land carbon sink in 2023 🚨
As the CO2 growth rate reached a record high at Mauna Loa, we set up a low-latency analysis of the carbon budget and found that plants and soils absorbed almost no CO2 last year "
"The decline of the northern sink was masked by recent good conditions in the Tropics absorbing #CO2, but in the coming years if this decline continues, we may see a rapid acceleration of CO2 and global warming which was unforeseen in future climate models projections."
See the whole thread with many charts and many more posts:
https://nitter.poast.org/ciais_philippe/status/1813909550891983318
In 2023, the CO2 growth rate was 3.37 +/- 0.11 ppm at Mauna Loa, 86% above the previous year, and hitting a record high since observations began in 1958, while global fossil fuel CO2 emissions only increased by 0.6 +/- 0.5%. This implies an unprecedented weakening of land and ocean sinks, and raises the question of where and why this reduction happened. Here we show a global net land CO2 sink of 0.44 +/- 0.21 GtC yr-1, the weakest since 2003. We used dynamic global vegetation models, satellites fire emissions, an atmospheric inversion based on OCO-2 measurements, and emulators of ocean biogeochemical and data driven models to deliver a fast-track carbon budget in 2023. Those models ensured consistency with previous carbon budgets. Regional flux anomalies from 2015-2022 are consistent between top-down and bottom-up approaches, with the largest abnormal carbon loss in the Amazon during the drought in the second half of 2023 (0.31 +/- 0.19 GtC yr-1), extreme fire emissions of 0.58 +/- 0.10 GtC yr-1 in Canada and a loss in South-East Asia (0.13 +/- 0.12 GtC yr-1). Since 2015, land CO2 uptake north of 20 degree N declined by half to 1.13 +/- 0.24 GtC yr-1 in 2023. Meanwhile, the tropics recovered from the 2015-16 El Nino carbon loss, gained carbon during the La Nina years (2020-2023), then switched to a carbon loss during the 2023 El Nino (0.56 +/- 0.23 GtC yr-1). The ocean sink was stronger than normal in the equatorial eastern Pacific due to reduced upwelling from La Nina's retreat in early 2023 and the development of El Nino later. Land regions exposed to extreme heat in 2023 contributed a gross carbon loss of 1.73 GtC yr-1, indicating that record warming in 2023 had a strong negative impact on the capacity of terrestrial ecosystems to mitigate climate change.
How much warming in the middle #Miocene 15million years ago came from methane?
Methane is not constrained at all for the Miocene.
But I did the maths –yet I also warn you: I am maths dyslexic. 😁
tldr: with assumed 10 times more wetlands than today and all of the remaining landmass assumed to be like today's tiny "wild rest",
CH4 emissions were 2124 Mt per year.
Which amounted to 6608 ppb CH4 in the atmosphere which in itself caused +2.1°C .
CO2 in 15Ma is not well constrained either. (see below)
I calculate 560ppm to have contributed 3°C (current science working theory for ECS ±1).
So methane 2.1°C and CO2 3°C on their own, omitting all other climate factors, caused +5.1°C in the Miocene.
The breakdown of the numbers follows. With links.
# CO2:
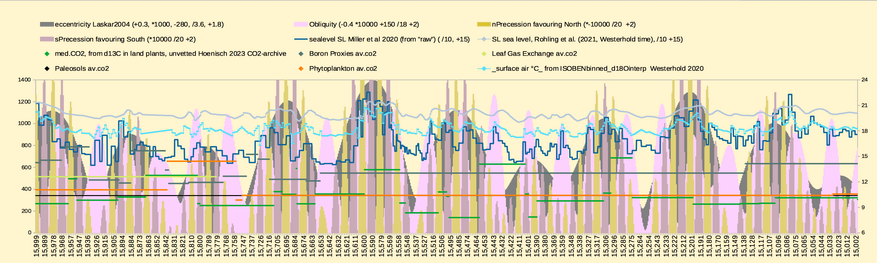
Hoenisch et al 2023 published meticulously revised CO2 values from global #d13C proxies https://paleo-co2.org , their considered-best proxies are all oceanic in origin.
The chart #1 of 1milion years 15 million years ago, shows #Hoenisch ' s CO2 proxies as the horizontal lines. I chose to fill the gaps with repeated values between the rare data points. So each line segment really is only 1 data point at its right-most end.
560 ppm CO2 seems an okay guess, no?
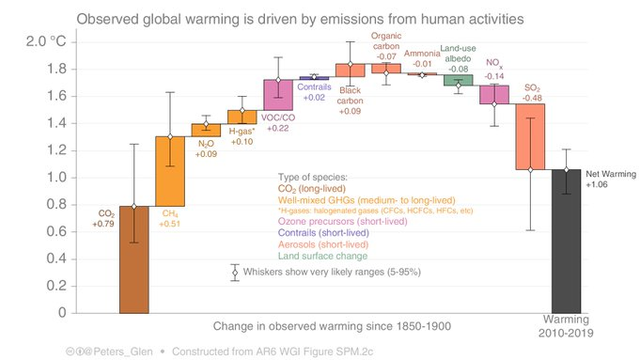
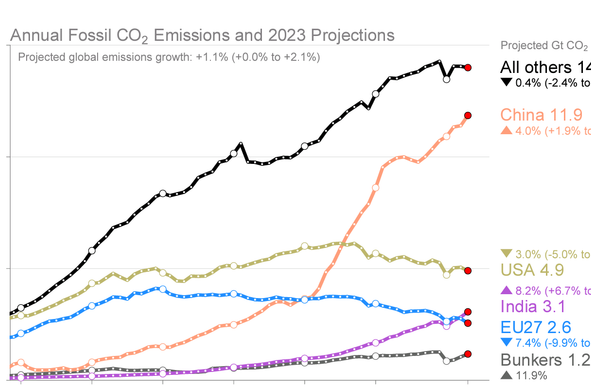
@Peters_Glen did a cool chart, more intuitive than the one in #AR6, I think. See pic 2 or his tweet where he plots the various greenhouse gases with their warming contribution 2010-2019: https://x.com/Peters_Glen/status/1431873249449680901
The average CH4 concentration in the decade 2010-2019 was 1840ppb (NOAA) and caused +0.51°C as per Glen's chart.
From Glen's chart follows my secret methane formula 😁
1 Mt methane <=> 3.111 ppb <=> 0.001 ºC
If emissions in 15Ma were 2124 Mt CH4 (see #landmass below), it resulted in 2.12°C at a concentration of 6608 ppb.
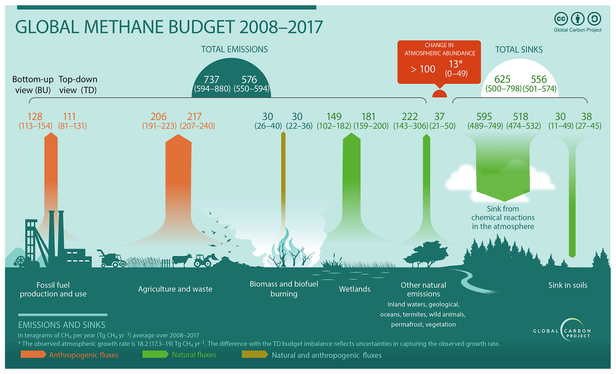
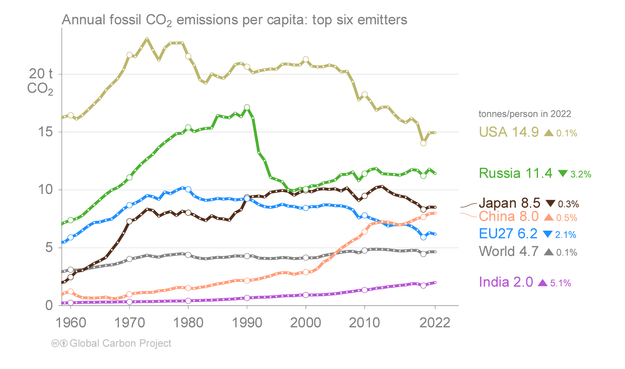
According to the Global Methane Budget by #GlobalCarbonProject : https://essd.copernicus.org/articles/12/1561/2020/
emissions from the "wild rest" 2008-2017 were 222 Mt CH4 annually . See picture 3.
The wild rest today is 54mio km2, according to #OurWorldInData https://ourworldindata.org/global-land-for-agriculture
Wild rest: 222 Mt CH4 from 54mio km2 = 4.1 t CH4 / km2.
Emissions from wetlands 2008-2017 were 180Mt CH4 (Tg=Mt) .
They cover 4.37% of the total land mass: https://ourworldindata.org/grapher/coverage-of-wetlands?tab=chart&country=~OWID_WRL
4.37% of 141mio km2 total is:
Wetlands 6.2mio km2.
Wetlands: 180 Mt from 6.2 km2 = 30 t CH4 / km2.
In 15Ma Miocene, 10 times more wetlands would have been
62 mio km2.
And
wild rest 79 mio km2.
wetlands 62mio km2 times 30t CH4 = 1800 Mt CH4
wild rest 79 mio km2 times 4.1t CH4 = 324 Mt CH4.
Wetlands plus wild rest:
1800 Mt + 324 Mt = 2124 Mt CH4
secret methane formula:
1 Mt methane <=> 3.111 ppb <=> 0.001 ºC
2124 Mt <=> 6608 ppb <=> 2.12°C
Why do I assume that wetlands were 10x more than today, tho? Why not 15, 20 or 5 times more?
Dunno. Well, humans have unwetted lotsa wetlands since the invention of agriculture in the #Holocene. (Btw, the area of today's dried peatland alone emits 2Gt CO2 per year. See table on dried wetland areas and their emissions GHG:
https://www.nature.com/articles/s41467-020-15499-z/tables/2 #Günther et al 2020, based on IPCC guidelines for wetlands https://www.ipcc.ch/publication/2013-supplement-to-the-2006-ipcc-guidelines-for-national-greenhouse-gas-inventories-wetlands/ )
Hard to tell what area was covered by wetlands in the previous interglacial 126thsd years ago.
And in the middle Miocene, 15Ma?
My thinking goes like this:
The #Sahara was still forested 15Ma. As was the Gobi Desert probably. The prairies in the US were still forested, even #Greenland and #Antarctica. Northern #Russia had much more land mass back then, too.
Some of the different vegetation compared to pre-Holocene was due to different topography: the Rockies and Alpes were much, much lower, the high mountain ranges in East Asia didn't exist. #Australia was 15° further South. See also #Steinthordottir et al 2021 in "Miocene The Future Of The Past https://agupubs.onlinelibrary.wiley.com/doi/full/10.1029/2020PA004037
And the whole special Miocene issue:
https://agupubs.onlinelibrary.wiley.com/doi/toc/10.1002/(ISSN)2572-4525.Miocene1
All land area had gap-less biomes growing. Mostly forests. What do forests do? Away from the coast, within the continents, forests control the hydrological cycle, how much evaporates and how much it rains. All biomes do, but forests most.
The more forests there are, the more it rains. Uninterrupted plant cover with its propagating rain cycle hinders deserts from forming in the heart of the continents, too.
Also, air holds 7% more water per 1°C warming, raising the potential rain amount.
Now, if it rains a lot, and depending on the topography, land is inundated temporary, seasonally or permanently, methane-producing microbes in the soil get to work presto, eat carbon and fart CH4.
The warmer it is, the more the microbes work.
But why 10x more wetlands?
Why not 7 or 15x?
Dunno. 10 feels right. And 6608ppb is nicely close to a guesstimate of mine that mid Miocene CH4 concentration cd have been 7000 ppb.
Maybe 400ppb came from huge animals, happily roaming among giant trees.
Brazil's Giant Sloth? The "wild rest" in the Miocene was HUGE! And cute.
#FridaysForFuture
#anloCH4
In absolute terms (first image), meaning by territorial responsibility, China is by far the largest emitter of CO2 today after its rapid, fossil-driven industrialization, with emissions still rising, while the emissions of US and EU are slightly falling, but only slowly. In the meantime, India has passed the EU in total emissions.
Per capita, an average US citizen is far ahead of everybody else in terms of causing climate heating, followed by Russia, China and the EU.