Tatu Leppämäki

@tadusko@mstdn.social
276 Followers
382 Following
204 Posts
A geography PhD student in Uni Helsinki @digigeolab. GIS, NLP, small movie theatres, games, wastelands, dogs and all that good stuff.
Researchhttps://orcid.org/0000-0002-9634-7943
Blueskyhttps://bsky.app/profile/tadusko.bsky.social

Our visiting researcher Davi Gressler presents his work on assessing realized 15-minute trips in US cities and comparing that to trips that were longer but could have been made in 15 minutes using SafeGraph data.

#15MinuteCity #Segregation

Following that is @tadusko presenting his work on the rise and fall of Flickr and use of its data in #GIScience at the #LBS2025 conference.

Key takeaway is that #Flickr is highly biased data produced in the Global North by a select few highly active users, but widely used in research because it is the only major social media platform that still allows data collection using its API. The question remains whether the data should be used.

Brilliant work all in all!

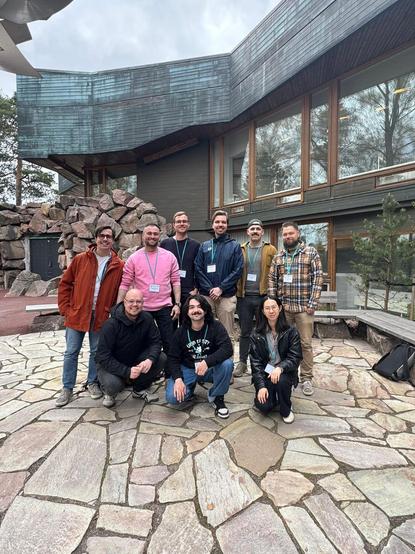
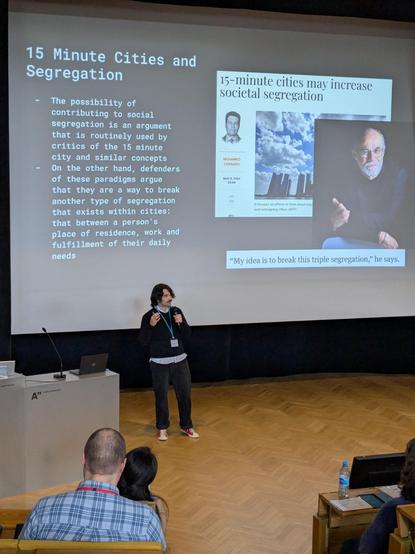
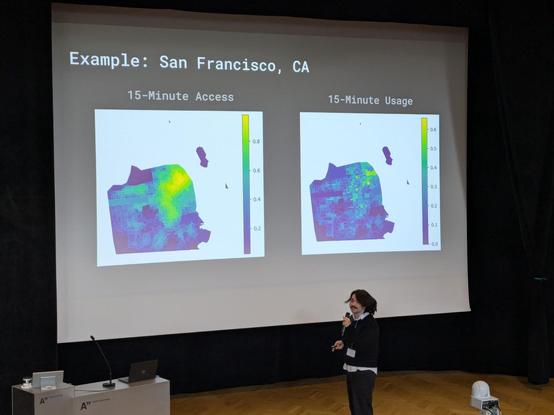
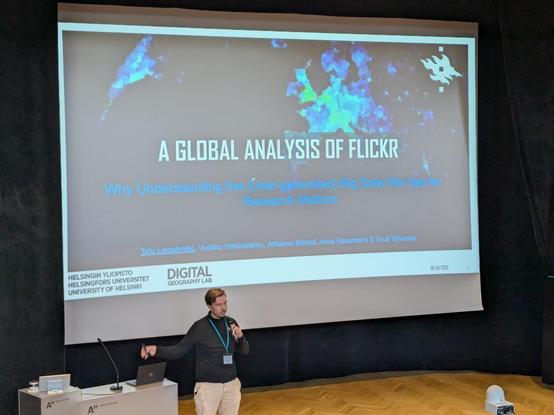
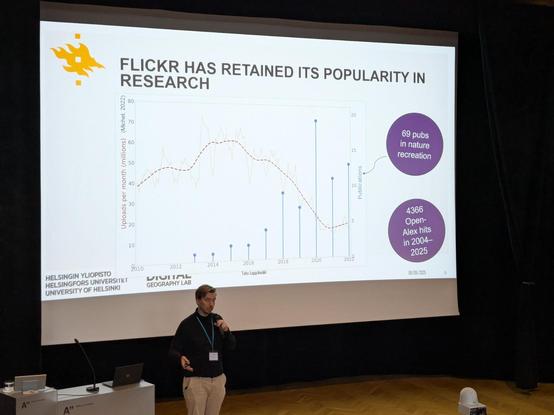
The second day of #LBS2025 conference is about to start, and so is the onslaught of presentations from @digigeolab members and alumni on topics like #mobility #BigData #GIScience #MachineLearning #NatureRecreation #Segregation #EcosystemServices #Geography

I have the dubious honor of the very last presentation of the day, acting as the firewall between the scientific program and the conference dinner. Let's see how many turn up 😅

This clip from “Dinosaurs” (1994) was 40 years ahead of itself.

Joshua Rozells' stunning image of the Australian desert illuminates the growing problem of satellite pollution.

https://www.thisiscolossal.com/2025/04/joshua-rozells-light-pollution/

#photography #nature

A Stunning Image of the Australian Desert Illuminates the Growing Problem of Satellite Pollution

Stitching together 343 distinct photos, Joshua Rozells illuminates a growing problem of satellites polluting the night sky.

Colossal

✨ NEW TOOL FOR #MOBILITY DATA #DATAVIZ ✈️🚚🚗🏃

Do your visualisations of origin-destination matrices look like a mess of criss-crossing hairs? Maybe you could benefit from our #EdgeBundling tool by me, Oula Inkeröinen, @miladmzdh and Olle Järv!

🛠️ The tool: https://doi.org/10.5281/zenodo.14532547

This tool is an output from the #MobiTwin project funded by the #EuropeanUnion through the #HorizonEU programme.

Edge-bundling tool for regional mobility flow data

Edge-bundling tool for regional mobility flow data This repository hosts the scripts to perform edge-path bundling (Wallinger et al. 2022) for flow data. It's primary use case is to support visualization of complex mobility data, and has been used to bundle human mobility flows across NUTS regions in Europe. The tool's inputs are two CSV files, one for point feature data and associated coordinates, and another for flows (edges) to be bundled. After bundling, the tool outputs a GeoPackage file. The script expects the data to be in WGS84 coordinate reference system. The scripts in this repo are repurposed versions of the original scripts written by Peterka (2023). The updates to the original code aim to make the code more usable for analytical purposes. This tool is an additional output of the Mobi-Twin research project. Requirements The scripts within the repo require Python 3.10 or newer version with the following packages: pandas geopandas tqdm shapely On top of these Python requirements, the script expects the input CSV data (centroids and edges) to have a certain structure. Data structure for input files Centroid file | ID_COLUMN | X | Y | | ---- | :----- | :---------- | | Unique identifier for centroid (e.g., NUTS code) | X coordinate (WGS84) of the centroid | Y coordinate (WGS84) of the centroid | N.B.: The ID_COLUMN in the above is an example name, use the column name you have in your data. Edge file | ORIGIN | DESTINATION | OD_ID | COUNT | | ---- | :----- | :---------- | :---------- | | ID code of origin | ID code of destination | ID made of origin and destination codes joined by an underscore (_) | Integer/floating point number of flow strength | N.B.: The ID codes of origins and destinations have to match the IDs of your centroid file. Usage Clone this repository, and run the tool by typing in the following command: python bundle_edges.py -c /path/to/centroids.csv -id ID_COLUMN -ew /path/to/edges.csv -o /path/to/output.gpkg If you want to adjust some parameters of the bundling, such as weights or bundling threshold use the flags -ew for edge weights (default is 2), and -t for bundling threshold (default is 2). The edge weights dictate how powerful the "gravity" of long edges are. The bundling threshold sets the distance limit for how many times longer the bundled edges can be compared to straight line distances, flows that are longer than the threshold are not bundled but remain as straight line geometries in the output. Please note, the script expects the coordinates to be in WGS84 (EPSG:4326) Test files We have provided two test CSV files that demonstrate the data structure of the required CSV files. These files can be found under the example_data directory. References Wallinger, M., Archambault, D., Auber, D., Nöllenburg, M., & Peltonen, J. (2022). Edge-Path Bundling: A Less Ambiguous Edge Bundling Approach. IEEE Transactions on Visualization and Computer Graphics, 28(1), 313–323. https://doi.org/10.1109/TVCG.2021.3114795 Peterka, O. (2024). Xpeterk1/edge-path-bundling. https://github.com/xpeterk1/edge-path-bundling (Original work published 2023). Related links Mobi-Twin project official webpage Digital Geography Lab webpage

Zenodo

Mobility viewpoint needs to be recognized in urban greening policies! 🚴‍🌳🏙️

New #GREENTRAVEL paper out!

A perspective paper by Silviya Korpilo et al., published in Ambio, describes how people’s contact with urban nature often happens when moving through space.

Interested? Read the paper here 👇
https://doi.org/10.1007/s13280-025-02178-w

Restoring nature, enhancing active mobility: The role of street greenery in the EU’s 2024 restoration law - Ambio

This article argues for the importance of integrating a mobility perspective into urban greenspace planning and practice related to the 2024 EU Nature Restoration Law. Street greenery can play an important multifunctional role in promoting ecosystem services and functions, sustainable mobility, and human health and well-being. However, planners need more evidence on how street vegetation affects health and well-being during everyday active mobility, as well as what type, where and for whom to enhance vegetation. We discuss current advancements and gaps in literature related to these topics, and identify key research priorities to support restoration policy and practice. These include: moving beyond dominant scientific thinking of being in place to moving through space in understanding greenery exposure and experience; use of multiple exposure metrics with attention to temporal dynamics; integration of objective and subjective assessments; and investigating further the role of street greenery in reducing environmental injustices.

SpringerLink

A cool new master's thesis on #mountainbiking in Finnish Lapland's #nationalparks. Mikko used #Strava and #Ridewithgps data to explore whether these sources accurately reflect where and when people like to bike. Could they even aid in managing these areas?

Gradu #maastopyöräily'stä Pallas-Ylläksellä, Pyhä-Luostossa ja UKK:ssa. Voisivatko urheilusovellusten massadatat auttaa kansallispuistojen suunnittelussa? Mikko Kangasmaa selvitti
https://mastodon.online/@digigeolab/114272932624871181

Digital Geography Lab (@digigeolab@mastodon.online)

Attached: 1 image 📢 New master's thesis finalised! 🎉 🎉 🎉 "Activity tracking data for protected area visitor monitoring: A case study of mountain biking using Strava Metro" by Mikko Kangasmaa 😍 🎓 Find the thesis here: https://helda.helsinki.fi/items/73ae8773-c8bd-4835-a599-c52f38f61b6b 📄 Find Mikko's summary here: https://blogs.helsinki.fi/digital-geography/2025/04/03/activity-tracking-data-for-protected-area-visitor-monitoring-a-case-study-of-mountain-biking-using-strava-metro/

Mastodon

🚨 NEW ARTICLE 🚨

How many photos are uploaded to Flickr? Where? By who? Why does any of it matter? We explore the rise and fall of #Flickr in this @digigeolab paper by yours truly, Vuokko Heikinheimo, @eklund_jo, Anna Hausmann & @tuuli – now out in the Journal of Outdoor Recreation and Tourism.

Article: https://authors.elsevier.com/sd/article/S2213-0780(25)00026-X

Thread 👇

#giscience #geography #gis #opendata

BONUS
Random highlights from the dataset:
1) Median time between capturing a photo and uploading it to Flickr is one week.
2) People (or bots) like to upload on round figures (see pic)
3) Normalized by population, Iceland has the most Flickr users in our dataset.

BTW, I tried to explain the plots also in the alt texts; they might help if some of the plots don't make sense.