✨ NEW TOOL FOR #MOBILITY DATA #DATAVIZ ✈️🚚🚗🏃

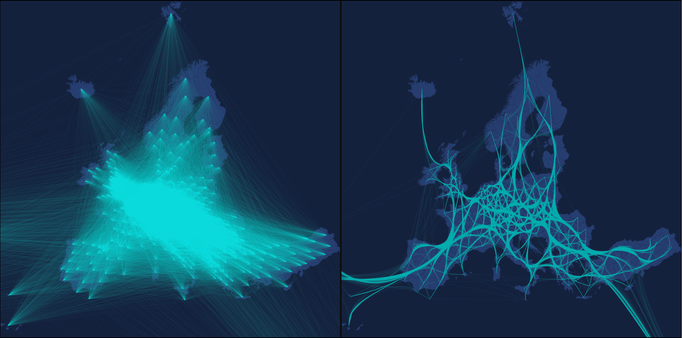
Do your visualisations of origin-destination matrices look like a mess of criss-crossing hairs? Maybe you could benefit from our #EdgeBundling tool by me, Oula Inkeröinen, @miladmzdh and Olle Järv!

🛠️ The tool: https://doi.org/10.5281/zenodo.14532547

This tool is an output from the #MobiTwin project funded by the #EuropeanUnion through the #HorizonEU programme.

Edge-bundling tool for regional mobility flow data

Edge-bundling tool for regional mobility flow data This repository hosts the scripts to perform edge-path bundling (Wallinger et al. 2022) for flow data. It's primary use case is to support visualization of complex mobility data, and has been used to bundle human mobility flows across NUTS regions in Europe. The tool's inputs are two CSV files, one for point feature data and associated coordinates, and another for flows (edges) to be bundled. After bundling, the tool outputs a GeoPackage file. The script expects the data to be in WGS84 coordinate reference system. The scripts in this repo are repurposed versions of the original scripts written by Peterka (2023). The updates to the original code aim to make the code more usable for analytical purposes. This tool is an additional output of the Mobi-Twin research project. Requirements The scripts within the repo require Python 3.10 or newer version with the following packages: pandas geopandas tqdm shapely On top of these Python requirements, the script expects the input CSV data (centroids and edges) to have a certain structure. Data structure for input files Centroid file | ID_COLUMN | X | Y | | ---- | :----- | :---------- | | Unique identifier for centroid (e.g., NUTS code) | X coordinate (WGS84) of the centroid | Y coordinate (WGS84) of the centroid | N.B.: The ID_COLUMN in the above is an example name, use the column name you have in your data. Edge file | ORIGIN | DESTINATION | OD_ID | COUNT | | ---- | :----- | :---------- | :---------- | | ID code of origin | ID code of destination | ID made of origin and destination codes joined by an underscore (_) | Integer/floating point number of flow strength | N.B.: The ID codes of origins and destinations have to match the IDs of your centroid file. Usage Clone this repository, and run the tool by typing in the following command: python bundle_edges.py -c /path/to/centroids.csv -id ID_COLUMN -ew /path/to/edges.csv -o /path/to/output.gpkg If you want to adjust some parameters of the bundling, such as weights or bundling threshold use the flags -ew for edge weights (default is 2), and -t for bundling threshold (default is 2). The edge weights dictate how powerful the "gravity" of long edges are. The bundling threshold sets the distance limit for how many times longer the bundled edges can be compared to straight line distances, flows that are longer than the threshold are not bundled but remain as straight line geometries in the output. Please note, the script expects the coordinates to be in WGS84 (EPSG:4326) Test files We have provided two test CSV files that demonstrate the data structure of the required CSV files. These files can be found under the example_data directory. References Wallinger, M., Archambault, D., Auber, D., Nöllenburg, M., & Peltonen, J. (2022). Edge-Path Bundling: A Less Ambiguous Edge Bundling Approach. IEEE Transactions on Visualization and Computer Graphics, 28(1), 313–323. https://doi.org/10.1109/TVCG.2021.3114795 Peterka, O. (2024). Xpeterk1/edge-path-bundling. https://github.com/xpeterk1/edge-path-bundling (Original work published 2023). Related links Mobi-Twin project official webpage Digital Geography Lab webpage
Zenodo

❓ What is edge-bundling?

Edge bundling is a technique where flows going from nearby points in a similar direction get bundled together to reduce visual clutter, and it can help with legibility of complex flow data.

🙋 Why should I use it?

a) To improve legibility of large and complex flow data between origins and destinations. A map that is not clear is worthless.

b) To make cooler visualisations.

c) Because it is fun!

d) All of the above!

💾 ✅ What do you need to use the tool?

a) A CSV file with origins, destinations and count of flows between them

b) Point layer, where each point represents unique origins and destinations in the CSV file

c) Our tool from https://doi.org/10.5281/zenodo.14532547

d) Python installed.

Edge-bundling tool for regional mobility flow data

Edge-bundling tool for regional mobility flow data This repository hosts the scripts to perform edge-path bundling (Wallinger et al. 2022) for flow data. It's primary use case is to support visualization of complex mobility data, and has been used to bundle human mobility flows across NUTS regions in Europe. The tool's inputs are two CSV files, one for point feature data and associated coordinates, and another for flows (edges) to be bundled. After bundling, the tool outputs a GeoPackage file. The script expects the data to be in WGS84 coordinate reference system. The scripts in this repo are repurposed versions of the original scripts written by Peterka (2023). The updates to the original code aim to make the code more usable for analytical purposes. This tool is an additional output of the Mobi-Twin research project. Requirements The scripts within the repo require Python 3.10 or newer version with the following packages: pandas geopandas tqdm shapely On top of these Python requirements, the script expects the input CSV data (centroids and edges) to have a certain structure. Data structure for input files Centroid file | ID_COLUMN | X | Y | | ---- | :----- | :---------- | | Unique identifier for centroid (e.g., NUTS code) | X coordinate (WGS84) of the centroid | Y coordinate (WGS84) of the centroid | N.B.: The ID_COLUMN in the above is an example name, use the column name you have in your data. Edge file | ORIGIN | DESTINATION | OD_ID | COUNT | | ---- | :----- | :---------- | :---------- | | ID code of origin | ID code of destination | ID made of origin and destination codes joined by an underscore (_) | Integer/floating point number of flow strength | N.B.: The ID codes of origins and destinations have to match the IDs of your centroid file. Usage Clone this repository, and run the tool by typing in the following command: python bundle_edges.py -c /path/to/centroids.csv -id ID_COLUMN -ew /path/to/edges.csv -o /path/to/output.gpkg If you want to adjust some parameters of the bundling, such as weights or bundling threshold use the flags -ew for edge weights (default is 2), and -t for bundling threshold (default is 2). The edge weights dictate how powerful the "gravity" of long edges are. The bundling threshold sets the distance limit for how many times longer the bundled edges can be compared to straight line distances, flows that are longer than the threshold are not bundled but remain as straight line geometries in the output. Please note, the script expects the coordinates to be in WGS84 (EPSG:4326) Test files We have provided two test CSV files that demonstrate the data structure of the required CSV files. These files can be found under the example_data directory. References Wallinger, M., Archambault, D., Auber, D., Nöllenburg, M., & Peltonen, J. (2022). Edge-Path Bundling: A Less Ambiguous Edge Bundling Approach. IEEE Transactions on Visualization and Computer Graphics, 28(1), 313–323. https://doi.org/10.1109/TVCG.2021.3114795 Peterka, O. (2024). Xpeterk1/edge-path-bundling. https://github.com/xpeterk1/edge-path-bundling (Original work published 2023). Related links Mobi-Twin project official webpage Digital Geography Lab webpage

Zenodo

📜 🧙‍♂️ How do I use the tool?

1. Run the tool as instructed in the README.md file from the repository.

2. Wait for the edges to be bundled.

3. Visualise your data!

If you don’t have data ready, you can try the data out on our newly published Erasmus+ mobility data available from Scientific Data!

📜 The article: https://doi.org/10.1038/s41597-025-04789-0

💾 The data: https://doi.org/10.5281/zenodo.14332353

@waeiski cable ties round your rendered edges. Got it 👍
@waeiski Looks very cool but when I look at the map with all the edges it seems like only half of the travels from Iceland go through UK airspace but in your aggregated view everything does.
@drgroftehauge Thanks for the great comment! You are correct in your observation. However, edge bundling is a visualization technique for origin-destination data. That is, nothing else about the mobility is known except where it started from and where it ends at. So the technique does not bundle the trajectories according to a "real route", it just bundles similar flows together visually to improve visual clarity. I will likely have to clarify this explicitly, thanks for raising the issue!
@waeiski It's not a major thing, I was just looking at it and going "Huh, most of the Icelandics are traveling via London. Wait a minute, that can't be right at all." 😁
@drgroftehauge Yeah 😅 but I think it is a major thing, being in my academic bubble of my specific field, it can quite easily escape me that something that I think is clear, might actually not be. So, to reiterate, thanks for the comment 👌
@waeiski @drgroftehauge while perhaps not intuitive these bundles that don't follow established transportation routes could have unexpected utility.
For example, our city is just implementing tapping and scanning of transit passes. If significant O-D bundles emerge from this new data that deviate from current transit routes then perhaps the current routes are based upon faulty assumptions. Of course, it's more complicated but this opens other avenues for analysis.
@waeiski WHAT A COOL MOBILITY TOOL!!! AMAZING!