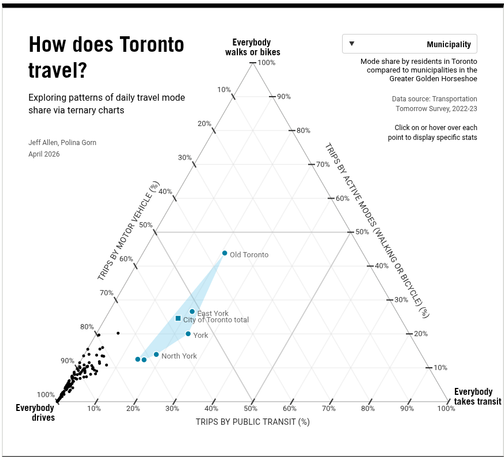
"How Does Toronto Travel?"
https://schoolofcities.github.io/transportation-tomorrow-survey/mode-ternary via https://schoolofcities.utoronto.ca/

| Blog | https://malcolmbastien.com |
"How Does Toronto Travel?"
https://schoolofcities.github.io/transportation-tomorrow-survey/mode-ternary via https://schoolofcities.utoronto.ca/
The Internet has become so bad. Whenever I visit websites on my phone, it's always an ad-riddled mess.
And increasingly, whenever I visit sites on my computer, I see this stupid thing.
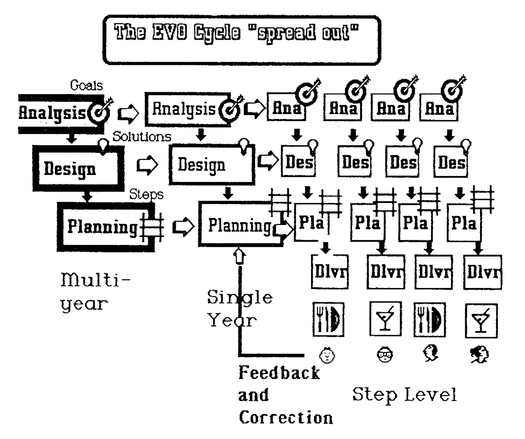
I'm currently reading Tom Gilb's paper titled Evolutionary Delivery versus the "Waterfall Model," which was published in 1985!
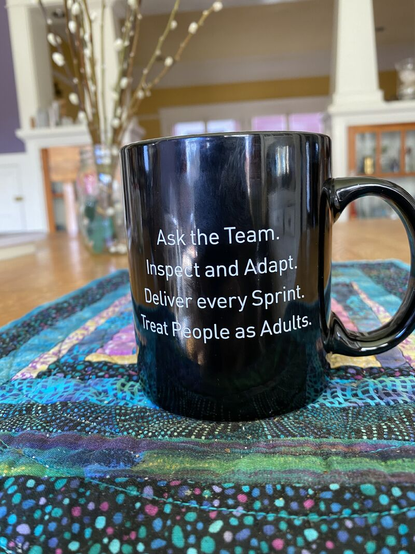
From Diana Larsen on Linkedin
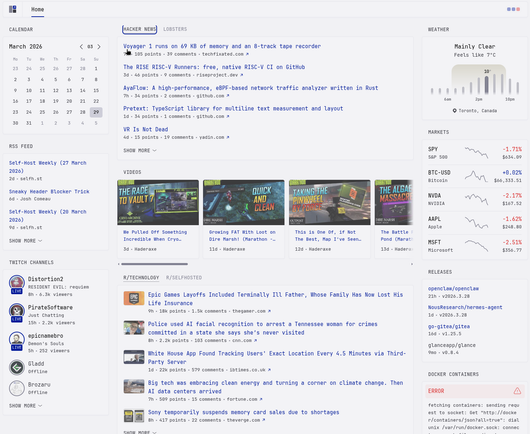
I set up Glance today, and it got me thinking that a self-hosted app that acts like my personal "feed for everything" makes so much sense. It emphasizes the importance of RSS, which the Internet can use more of.
It's a bit of a shame that Glance's last update was July 2025.
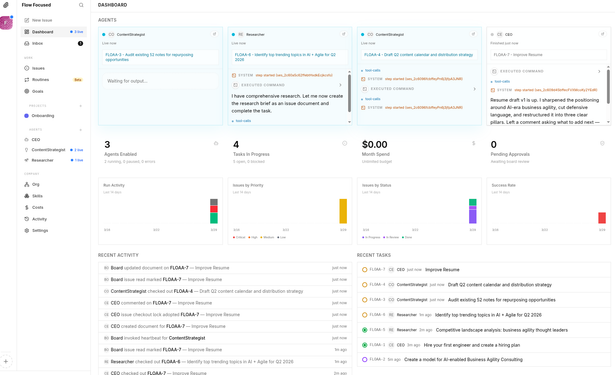
Paperclip is a super interesting tool. Create a goal and have an agent start "hiring" other agents, and delegating tasks. The agents then work on their tasks in parallel and report on progress.
It's pretty intuitive to use, sort of like you're at the helm of something powerful.
I think this is a pretty interesting use case for MCP.
I want my AI systems to have more access to my Obsidian notes, but I want to be careful that they can't go off the rails unexpectedly with permissions to delete whatever they want
The Task Genius plugin comes bundled with an MCP server, which I can use to let them interact with my tasks, but not my notes as a whole.

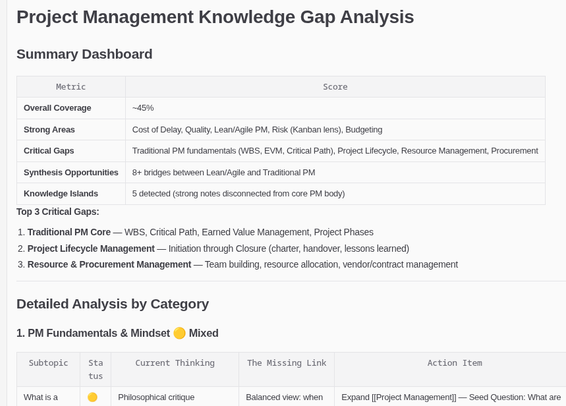
I had an idea yesterday that if I think of my #Obsidian vault as a reflection of what I know (aka my "External brain"), then I could use AI to create a topic map that audits my knowledge gaps.
This can help me identify specific areas to study to fill those gaps. I can then turn this topic map into a plan by either pasting the formatted output back into Obsidian or writing to it directly, complete with tasks and links to notes.