Joana Simoes

@doublebyte@noc.social
358 Followers
184 Following
617 Posts
Data Engineer/ Data Scientist turned Developer Relations at #OGC. Digital nomad before the term was coined. Views are my own.
GitHubhttps://github.com/doublebyte1/
Bloghttps://doublebyteblog.wordpress.com/
PronounsShe/Her
TimezoneCET
@geomob @luis_de_sousa Parabéns, Luis! 👏

Are you curious about the "Future of GIS"? If yes, tune in to episode 290. of the **#geomobpod **to hear about discrete global grid systems from Instituto Superior Técnico lecturer @luis_de_sousa.

He provides an overview of what DGG systems are, the challenges of existing systems like H3 and why they could prove to be so important in the future.

Enjoy:

https://thegeomob.com/podcast/episode-290

290. Luís de Sousa: Discrete Global Grid Systems

Luís joins the show to share his work on Discrete Global Grid Systems. the 'future of GIS'.

Um exemplo pratico pela mao do IGN de Espanha, de como #OGCAPI simplificou o acesso á informacao geospacial #standards #OGC #cartografia #GIS https://blog.idee.es/archivo/-/blogs/de-la-complejidad-de-wfs-a-la-simplicidad-de-ogc-api-features
De la complejidad de WFS a la simplicidad de OGC API – Features - Blog IDEE

¿Te frustra consultar servicios WFS con «endpoints» kilométricos? ¿Quieres obtener todas las direcciones de un código postal? Si es así, este artículo es para ti. Por suerte, las OGC API - Features han llegado para facilitarnos la vida: peticiones simples, formatos modernos como JSON o GeoJSON y una estructura que cualquier desarrollador entiende a la...

Blog IDEE

Our new WMO Ozone and Ultraviolet Radiation Data Centre platform (WOUDC 2.0) has been released!

Improved data management, all OGC APIs, all FOSS.

https://woudc.org
https://api.woudc.org

#wmo #pygeoapi #foss4g @osgeo @opengeospatial

woudc-ui

Discover, Visualize and Access a Global Archive of Ground-based Ozone and UV Radiation Data

woudc-ui
@stadiamaps @ianthetechie @stamen it is no secret that the #stamen watercolor is my favorite style ever! 🥰 #tiledmaps
@doublebyte saw this on my personal account ( @ianthetechie) and recognized the @stamen style 😍
@doublebyte Yeah, people don't usually do that.
@IvanSanchez Good point :-) This approach theoretical approach assumes they could be walking across buildings...
17.14. First analysis example — QGIS Documentation documentation

QGIS 3.40 documentation: 17.14. First analysis example

@cwillmes yes: it was the broad street pump. Once it was closed, the cholera cases dropped!
×
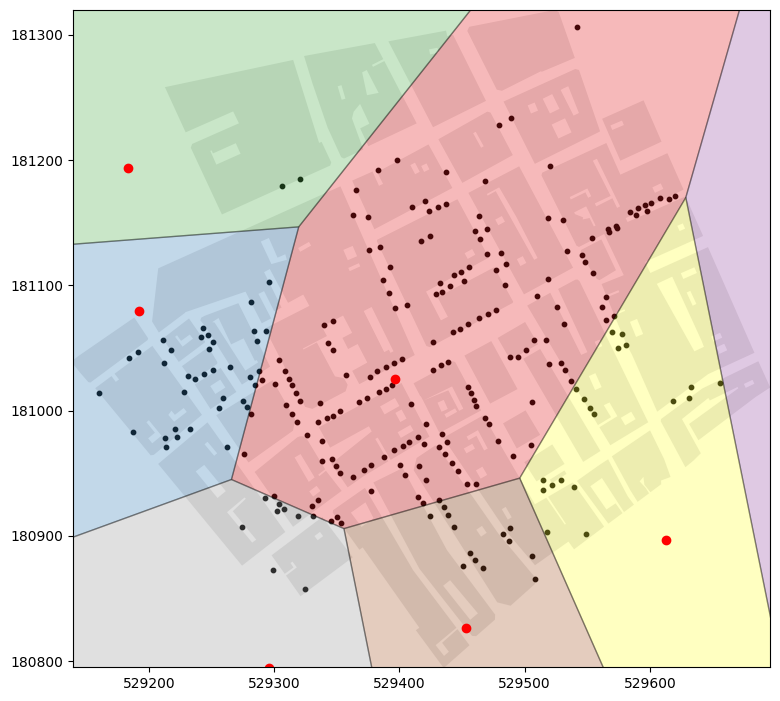
The analysis using #Thiessen polygons shows an even more evident concentration of cholera cases around the broad street pump #Voronoi #SnowAnalysis #SnowKaggle #GIS #BTS
@doublebyte but the point of the spatial analysis is to find the contaminated pump. The pump locations (red dots) are the "center" points of the constructed thiessen polygons... "winner" is the polygon with the most colera cases.
@cwillmes yes: it was the broad street pump. Once it was closed, the cholera cases dropped!
@doublebyte yes, I know! I use this data set in my spatial analysis class to teach the students point pattern analysis. :)
17.14. First analysis example — QGIS Documentation documentation

QGIS 3.40 documentation: 17.14. First analysis example

@doublebyte That tesselation doesn't take into account the shape of the street network, though.
Or, to put it in another way: people don't walk from a house to a pump in a straight line.
@IvanSanchez Good point :-) This approach theoretical approach assumes they could be walking across buildings...
@doublebyte Yeah, people don't usually do that.