Home
Explore
mastodon.social
mstdn.jp
mstdn.social
infosec.exchange
mas.to
piaille.fr
mastodon.world
hachyderm.io
social.vivaldi.net
m.cmx.im
troet.cafe
mastodon.uno
mastodon.gamedev.place
techhub.social
mastodon.nl
social.tchncs.de
kolektiva.social
norden.social
mathstodon.xyz
mastodonapp.uk
universeodon.com
tech.lgbt
nrw.social
mstdn.ca
c.im
occm.cc
mastodon-japan.net
mastodon.sdf.org
aus.social
sfba.social
mastodon.scot
masto.es
det.social
sueden.social
toot.community
mstdn.party
ohai.social
defcon.social
mastodon.ie
mastodontech.de
ruhr.social
hessen.social
mastodon.nu
ioc.exchange
flipboard.social
feuerwehr.social
social.linux.pizza
mastodon.eus
social.cologne
mastodon.au
livellosegreto.it
indieweb.social
muenchen.social
mindly.social
mastodont.cat
ieji.de
mastodon.green
social.anoxinon.de
nerdculture.de
pouet.chapril.org
ruby.social
mastodon.nz
wehavecookies.social
mastodon.bida.im
mastodontti.fi
cyberplace.social
phpc.social
metalhead.club
mastodon.ml
pol.social
dresden.network
toot.wales
climatejustice.social
tkz.one
mastouille.fr
m.otter.homes
noc.social
masto.nu
sciences.social
toot.io
sunny.garden
mstdn.business
mstdn.plus
uri.life
ravenation.club
urbanists.social
bark.lgbt
mastodon.me.uk
hostux.social
blorbo.social
glasgow.social
furry.engineer
rollenspiel.social
freiburg.social
tooting.ch
bonn.social
mastorol.es
discuss.systems
mast.lat
mstdn.games
masto.pt
ursal.zone
wien.rocks
rheinneckar.social
mapstodon.space
rivals.space
hcommons.social
mastodon-belgium.be
mastoot.fr
snabelen.no
expressional.social
ludosphere.fr
tilde.zone
mastodon.gal
peoplemaking.games
socel.net
shelter.moe
sociale.network
qdon.space
cupoftea.social
lgbtqia.space
h4.io
union.place
toad.social
mast.dragon-fly.club
gaygeek.social
theblower.au
woof.tech
stranger.social
sakurajima.moe
famichiki.jp
fairy.id
pawb.fun
toot.aquilenet.fr
mastodon.berlin
urusai.social
tooot.im
kanoa.de
bookstodon.com
vmst.io
musicworld.social
graphics.social
mastodon.uy
witter.cz
corteximplant.com
freeradical.zone
4bear.com
eupolicy.social
cr8r.gg
oslo.town
retro.pizza
disabled.social
fandom.ink
xarxa.cloud
mustard.blog
qaf.men
historians.social
mastodon.holeyfox.co
tooter.social
pnw.zone
machteburch.social
furries.club
musicians.today
mstdn.dk
libretooth.gr
mountains.social
dizl.de
babka.social
muri.network
masto.nobigtech.es
masto.nyc
toot.kif.rocks
archaeo.social
dmv.community
cosocial.ca
vkl.world
musician.social
mastodon.com.pl
mastodon.energy
mastoturk.org
fedi.at
bahn.social
social.seattle.wa.us
mastodon.pnpde.social
convo.casa
drupal.community
fulda.social
hear-me.social
bzh.social
frikiverse.zone
gamepad.club
donphan.social
mast.hpc.social
burma.social
norcal.social
ani.work
tyrol.social
mograph.social
tchafia.be
ciberlandia.pt
wargamers.social
social.silicon.moe
social.politicaconciencia.org
hometech.social
augsburg.social
puntarella.party
is.nota.live
toot.si
theatl.social
toot.funami.tech
epicure.social
tuiter.rocks
burningboard.net
genealysis.social
khiar.net
datasci.social
esq.social
est.social
opencoaster.net
gardenstate.social
elekk.xyz
lou.lt
mastodon.pirateparty.be
mastodon.africa
hispagatos.space
mastodon.london
indieauthors.social
mstdn.animexx.de
kurry.social
cultur.social
mastodon.education
friendsofdesoto.social
planetearth.social
hoosier.social
colorid.es
mastodon.vlaanderen
apobangpo.space
toot.garden
cyberfurz.social
earthstream.social
lsbt.me
opalstack.social
seocommunity.social
kfem.cat
mastodon.cr
arvr.social
mastodon.wien
h-net.social
jvm.social
fribygda.no
drumstodon.net
techtoots.com
ruhrpott.social
poweredbygay.social
rheinhessen.social
toot.re
leipzig.town
guitar.rodeo
metalverse.social
raphus.social
mastodon.free-solutions.org
lewacki.space
mastodon.bot
toots.nu
frontrange.co
fikaverse.club
cwb.social
mastodon.sg
social.veraciousnetwork.com
rail.chat
vermont.masto.host
x0r.be
masto.yttrx.com
elizur.me
squawk.mytransponder.com
library.love
camp.smolnet.org
devianze.city
mastodon.hosnet.fr
clj.social
paktodon.asia
growers.social
mastodon.escepticos.es
okla.social
bologna.one
synapse.cafe
birdon.social
mastodon.cipherbliss.com
social.diva.exchange
mastodon-swiss.org
balkan.fedive.rs
ailbhean.co-shaoghal.net
mastodon.bachgau.social
stereodon.social
k8s.social
skastodon.com
nomanssky.social
mastodon.iow.social
mastodon.babb.no
cville.online
biplus.social
episcodon.net
freemasonry.social
mastodon.ph
kcmo.social
mastodon.frl
silversword.online
kzoo.to
nfld.me
23.illuminati.org
mcr.wtf
voi.social
social.ferrocarril.net
ms.maritime.social
social.sndevs.com
polsci.social
mastodon.ee
nwb.social
dariox.club
mastodon.mg
mastodon.bahia.no
mastodon.vanlife.is
darticulate.com
troet.fediverse.at
bvb.social
ceilidh.online
mikumikudance.cloud
kjas.no
fpl.social
jaxbeach.social
tea.codes
learningdisability.social
wxw.moe
computerfairi.es
Log In
Joana Simoes
Jun 5
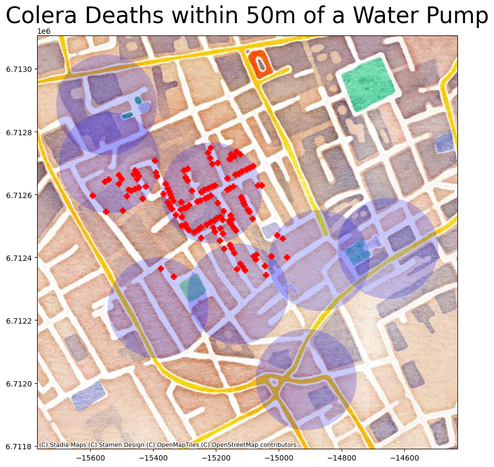
Reported deaths in Soho outbreak in London 1854 - It is always fun to revisit Snow's analysis with modern GIS tools!
#python
#SnowKaggle
#GIS
#Analysis
#BTS
#BigData
https://
en.wikipedia.org/wiki/John_Sno
w
4
1
1
Show thread
Joana Simoes
Jun 5
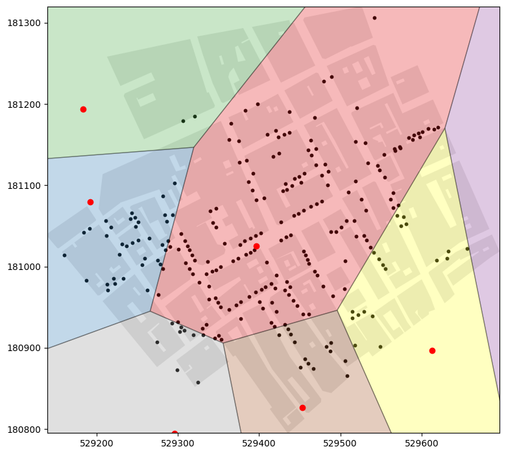
The analysis using
#Thiessen
polygons shows an even more evident concentration of cholera cases around the broad street pump
#Voronoi
#SnowAnalysis
#SnowKaggle
#GIS
#BTS
2
0
0
Show thread
Christian Willmes
Jun 5
@doublebyte
but the point of the spatial analysis is to find the contaminated pump. The pump locations (red dots) are the "center" points of the constructed thiessen polygons... "winner" is the polygon with the most colera cases.
1
0
0
Show thread
Joana Simoes
Jun 5
@cwillmes
yes: it was the broad street pump. Once it was closed, the cholera cases dropped!
1
0
1
Show thread
Christian Willmes
Jun 5
@doublebyte
yes, I know! I use this data set in my spatial analysis class to teach the students point pattern analysis. :)
1
0
1
Show thread
Christian Willmes
@doublebyte
I got the data from the QGIS training manual:
https://
docs.qgis.org/3.40/en/docs/tra
ining_manual/processing/john_snow.html
17.14. First analysis example — QGIS Documentation documentation
QGIS 3.40 documentation: 17.14. First analysis example
0
1
1