Alan McConchie

@alan@subdued.social
1.5K Followers
1.2K Following
1.7K Posts

Admin of subdued.social in #BellinghamWA. Lead Cartographer at https://vis.social/@stamen. Social media for https://social.ridetrans.it/@CascadiaRail. 15 minutes of fame: @pop_vs_soda

Was @mappingmashups on Twitter.
#cartography, #dataviz, #urbanism, #RankedChoiceVoting, #ElectoralReform, #ProportionalRepresentation, #HighSpeedRail, #OpenStreetMap, #TheExpanse

Don't want local content? Just mute the #BellinghamWA hashtag.

pronoun.is/he

Older posts: https://mastodon.social/@mappingmashups

Websitehttps://mappingmashups.net
My "Blog"https://mappingmashups.medium.com
My Coworking Space in Bellinghamhttps://localgroup.studio
My 15 Minutes of Famehttps://popvssoda.com

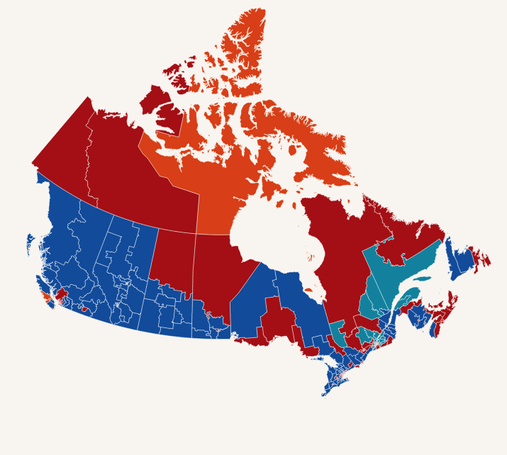
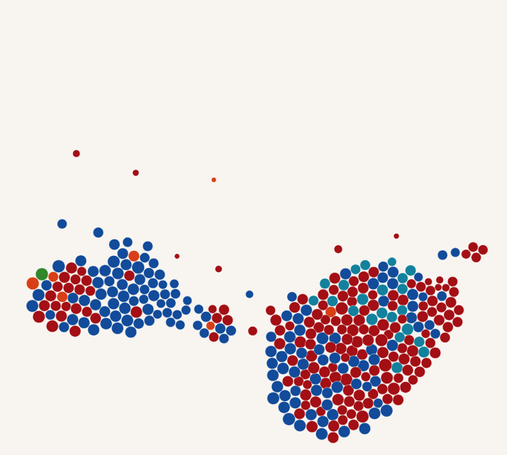
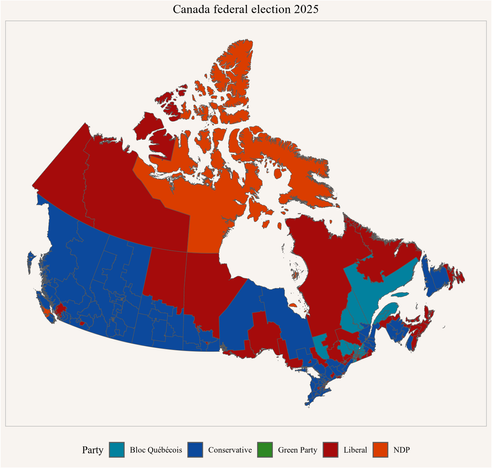
It's time for the "land doesn't vote, people do" map, Canada 2025 edition:

Created by Jens von Bergmann (@jensvb.bsky.social@bsky.brid.gy / @vb_jens) with more details and a cool animation here: https://doodles.mountainmath.ca/posts/2025-04-28-elections-fun---2025-edition/

#CanadaElection #CanadaVotes #elxn45 #Canada #cdnpoli

Elections fun - 2025 edition – Mountain Doodles

Playing with Canadian 2025 federal elections data.

Mountain Doodles
Whatcom County Eyes a Prime Election Upgrade | Sightline Institute

Takeaways Can your voice be heard if you’re in a small red bubble in a blue sea? Or if you see yourself as one of a handful of blue flowers in a field of red?   In most of Cascadia’s governing bodies, the answer is no. In the region’s prevailing winner-take-all elections, whichever side gets the ... Read more

Sightline Institute
‘Billboard’ sculpture at Blaine border has welcomed our northern neighbors to US since 2010 | Cascadia Daily News

Part of redevelopment project, 'Non Sign II' was designed by two Seattle artists

Ok, final update of this chart for day 43, now that the results have been finalized and the Electoral College has met. In the end, Trump's total is 49.9% of the total vote. The 4.7 million vote gap between Trump and Harris on election night narrowed to 2.3 million by the time all the votes were counted.

#ElectoralCollege #uspol #uspolitics #election2024

Updated for day 24. The curves are no longer growing logarithmically so I removed the trendline. I think we're very close to the final numbers now. #election2024 #uspol #uspolitics

I updated the chart of popular vote totals for day 20. The lines for 2024 continue to flatten out, suggesting that we are counting votes faster this time than in 2020.

Although it's hard to see on the chart, Harris's 2024 votes (so far) have now passed Trump's final totals from 2020.

Also, according to Wikipedia (sourced from AP News) Trump's share of the vote in 2024 still sits exactly at 50.0%. It will likely drop below 50% when all the votes are counted. #election2024 #uspol #uspolitics

Updated for day 16

And here is the same popular vote count chart, plotted on a logarithmic scale, with a trend line fitted to each data series. Adjusting the X axis like this means that the trend shows up as a straight line.

This is not at all a scientific way to estimate the final results, but you can see a rough approximation of what the final numbers might be in two or three more weeks. The popular vote will be very close in the end, but Harris will not overtake.

#uspolitics #uspol #election2024 #PopularVote

Here's the presidential popular vote chart for day 14, compared with where the totals were at this time in 2020.

The gap between Trump and Harris continues to narrow (and Trump is about to drop below 50% of the total vote according to Wikipedia). But the growth of both totals appears to be slowing relative to 2020. That likely means that the remaining votes are being counted a bit faster than last time.

#election2024 #uspol #PopularVote #uspolitics

I updated my popular vote count chart for Day 11: