Alyx Burns (he/him)

@AJBurns@hci.social
71 Followers
81 Following
123 Posts

Assistant Professor in CS at Mount Holyoke College; PhD from UMass Amherst

I study and teach how to make data visualizations & computers work for real people.

🏳️‍🌈

Website:https://www.alyxburns.com/

📣 alt.VIS is back for 2025!

Bring your weird, wacky, creative, outsidery dreams of what visualization is and could be!

Running alongside #ieeevis, we've got 2 tracks this time:
* trad.alt -- the full "papers" track
* alt.alt -- an abstract-only track for your ideas that you want to discuss more or build community around!

Deadline is August 1st

https://altvis.github.io/

alt.VIS

A half-day workshop at IEEE VIS 2025

Call for presentations is live! Got thoughts on how we represent information in a world that just won’t sit still? Information+ 2025 is looking for bold, thoughtful, and interdisciplinary proposals that push the conversation forward in information design and data visualization.

Important dates:
May 23, 2025: Deadline to submit abstract (90-150 words)
May 31 - June 6, 2025: Submission period for full presentation proposals (400-800 words)

Details and submission info: https://informationplusconference.com/2025/submissions.html

Information+ Conference 2025

Hi folks! If you'll be at #chi2025 this year, come check out my new paper "Intra, Extra, Read all about it: How Readers Interpret Visualizations with Intra- and Extratextual Information"!

It's an exploratory interview study examining how students combined information in the visualization (intratextual) with information they already knew (extratextual) to make meaning.

Pre-print available here: https://www.alyxburns.com/files/Intra_Extra_PREPRINT.pdf

Here is my #chi2025 paper explorer. Visually explore papers by similarity, search for an specific topic or even find what specific sessions to attend. Please let me know what you think! #dataviz @chi

👉🏼 https://johnguerra.co/viz/chi2025Papers/ 👈🏼

CHI2025 Paper Explorer

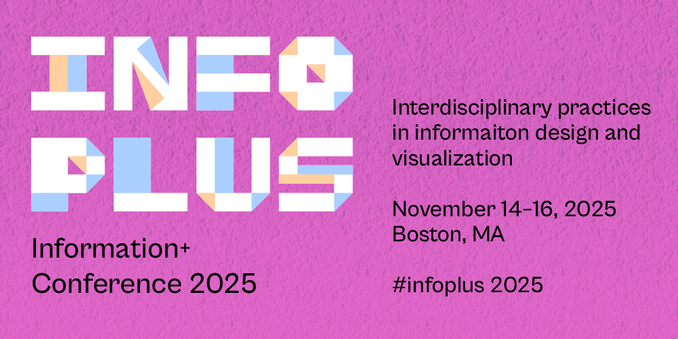
Save the date for the Info+ conference this year at Northeastern & MIT November 14–16! For those who haven't attended, the conference explores and celebrates information design and data visualization across a range of disciplines, practices, applications, and provocations. Submissions for presentations, workshops, and exhibition pieces open in April. Check out the site and stay tuned! https://informationplusconference.com/2025/
Information+ Conference 2025

Hey #visualization #datavis folks - the DVS Outlier Conference call for speakers is now up, deadline is Mar 15!

This year's theme: reimagining. This year's place: Miami + virtual.

https://www.datavisualizationsociety.org/news/2025/2/21/outlier-2025-speaker-application-now-open

Outlier 2025 - Speaker Application now open — Data Visualization Society

Outlier 2025 speaker applications are open through March 15, 2025 . Talks can be delivered in Miami, Florida or virtually. Submit a talk related to our 2025 theme 'reimagining'—whether it's redefining your creative approach, uncovering new ways to connect with people, or developing unique methods

Data Visualization Society

ReVISit 2.0 (revisit.dev) has reached several exciting milestones recently:

📁 Define an **entire** experiment in a single file-- (visualizations, data, study sequence, questionnaires, etc.)

🛫 Pilot and iterate on the experiment within a notebook environment.

📈 Test data collection and prototype your analyses in the same notebook!

See it in action in this clip, where we replicate a correlation perception experiment in ~160 lines of Python.

💻 Code available here ➡️ https://github.com/revisit-studies/revisitpy-examples/blob/main/example_jnd_study/example_jnd_study.ipynb

revisitpy-examples/example_jnd_study/example_jnd_study.ipynb at main · revisit-studies/revisitpy-examples

Example directory for all revisit-py features. Contribute to revisit-studies/revisitpy-examples development by creating an account on GitHub.

GitHub

Reposting this from bsky: My new lab is running its first study! Its a little (paid) interview study about data serialization formats (like yaml, json, and friends). Do you have opinions? We'd love to hear them

https://bsky.app/profile/havoc-lab.bsky.social/post/3lfxxocz52225

HAVOC Lab (@havoc-lab.bsky.social)

We are seeking participants for a PAID study on the usability of data serialization formats. If you’re interested, please fill out this form to sign up! https://docs.google.com/forms/d/e/1FAIpQLSf8knIRZTBwhvW1IJXX5ydsN_SA42jNxcRZf5wMo0uipXSgyQ/viewform?usp=header

Bluesky Social
We’ve released reVISit 2.0 (http://revisit.dev), the latest version of our open user study platform! There are a LOT of awesome new things in this release that will not only make it easier to run your user study for #ieeevis, but give you new analysis capabilities. #datavis
https://www.youtube.com/watch?v=wjP35gra9J4
Home | ReVISit

reVISit: Reproducible and Powerful Visualization User Studies

A young researcher at Northeastern University is doing a survey of crafters and makers.

Have you used data, or represented data, in your work?

Here is the link to the details and survey. I think it's cool that someone finds data + craft a worthy topic of research. And I like to help students.

#BobbinLace #tatting #crochet #knitting #embroidery #sewing #weaving

https://redd.it/1i4ii4u