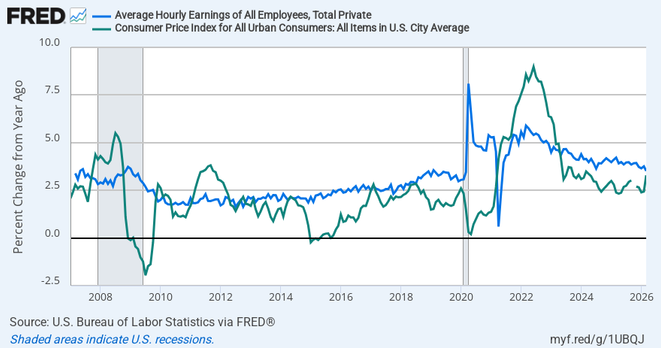
#Inflation Surges as Effects of the #IranWar Show in Prices

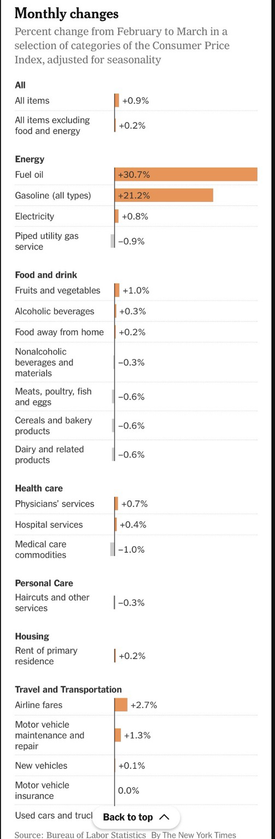
The #Consumer Price Index [#CPI] jumped 3.3% in the year through March, a 2-year high, reflecting higher costs for #energy & goods affected by disruptions in the #MiddleEast.

#TrumpsWar #US #Iran #Israel #war #Trump #law #Congress #WarPowers #geopolitics #NationalSecurity #economy #affordability #CostOfLiving #oil #EnergyCrisis
https://www.nytimes.com/live/2026/04/10/business/inflation-cpi-report?smid=nytcore-ios-share

Inflation Surges as Effects of the Iran War Show in Prices

The Consumer Price Index jumped 3.3 percent in the year through March, a two-year high, reflecting higher costs for energy and goods affected by disruptions in the Middle East.

The New York Times

If you are noticing that your morning cup of #coffee seems more expensive, it’s not your imagination. Coffee #prices are up 18.7%‼️ over the year, & 1.3% in March. That price spike is due to a number of factors, including #tariffs & #ExtremeWeather that has hurt the global supply of beans.

#economy #ClimateChange #TrumpTariffs

Within #energy, it’s worth noting that while #gasoline was up 21.2%, fuel #oil has increased even faster, by 30.7% over the month. That hits households in the #US #Northeast, which more commonly #heat with oil. Other motor #fuels, which mostly includes #diesel, jumped 30.8%.

#TrumpsWar #IranWar #US #Iran #Israel #war #Trump #law #Congress #WarPowers #geopolitics #NationalSecurity #MiddleEast #inflation #economy #affordability #CostOfLiving #EnergyCrisis

Average hourly #earnings, which had been running comfortably ahead of #inflation since mid-2023, are now creeping closer to the annual pace of price increases, having dropped to 3.5% year over year in March. Consumers are already starting to feel that compression.

#economy #affordability #CostOfLiving #wages #income #labor
https://fred.stlouisfed.org/graph/?g=1UBQJ

FRED Graph

Graph and download economic data for Average Hourly Earnings of All Employees, Total Private from Jan 1947 to Mar 2026 about establishment survey, average, earnings, hours, wages, private, employment, USA, headline figure, all items, urban, consumer, CPI, inflation, price index, indexes, and price.

Other survey-based indicators suggest that #US manufactured #goods will continue to increase in price. The pricing component of the Institute for Supply Management’s Purchasing Manager’s Index for March registered at 78.3%, the highest level since June 2022, indicating that a growing number of respondents were paying more for their inputs.

https://www.ismworld.org/globalassets/pub/research-and-surveys/rob/pmi/iw4r202603pmi.pdf

#Trump #economy #inflation #affordability #CostOfLiving #oil #energy #EnergyCrisis #TrumpTariffs #geopolitics

While the price of #food at home fell for the month, there were a couple of worrying signs in staples for consumers. One big one: The price of #PeanutButter jumped 2.2% from last month, & is up 5.3% in the last year, as a lot of peanut producing areas are facing a #drought. #US #farmers are estimated to be planting 15% fewer acres of #peanuts this year than last year, so the peanut supply could diminish even more.

#Trump #economy #inflation #affordability #CostOfLiving #ClimateChange