Today I will be tooting about the Historical Network Research Conference #HNR2024, day 2. https://historicalnetworkresearch.github.io/lausanne/program/
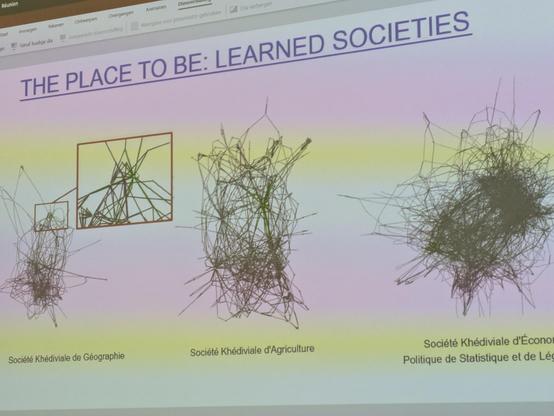
@GrandjeanMartin opens the day. He has been using a network to make the program and find which papers go best together. #hnr2024
Custom-made versions of that network, more friendly.
🌈 Note: the rainbow colors arise from my camera interacting weirdly with the projection! Be reassured that Martin's slides are very monochromatically serious.
@martenduering narrates how he came to believe that would be possible to work with networks in history.
A key paper for him was this one by Claire Lemercier:
Formal network methods in history: why and how?
https://shs.hal.science/halshs-00521527v2/document
"My hope is that it stays open and loosely defined."
@martenduering about the field in general, and in particular the HNR community spaces like the Journal of Historical Network Research (JHNR).
https://jhnr.net/
@martenduering about the field in general, and in particular the HNR community spaces like the Journal of Historical Network Research (JHNR).
https://jhnr.net/
HNR personas according to @martenduering :
* The historian
* The historical sociologist
* The computer scientist
* The network scientist
* The multi-talents
"You have guessed that we need all of them."
#hnr2024
A key insight from Marten: a very important part of the HNR community consists of historians, and more precisely people who do not define themselves as *digital* humanists or *digital* historians but just historians, and who need networks to get the job done.
The digital/computational is not necessarily a career path, it sometimes comes to you whether you want it or not, and it does not define you even if you embrace it for a time.
@lucasrappo presents his work about the land market in Lausanne in the 19th century.
Source: two cadastral maps, from 1931 and 1888, that he datafied.
By comparing them, he can identify where the city expanded.
From there, he could go back to the register of the land plots, and obtain a network of who sold which land to whom in the areas where the city expanded.
For one of the two areas where the city expanded, the story told by the data, says @lucasrappo, is that of families of local elites and older generations passing their belongings on to new generations, with not much involvement of the city of Lausanne itself.
For the other area where the city expanded, the story is different. A key actor emerges, an engineer and entrepreneur, who was probably engaging in financial speculation, as his node centrality in the financial market network suggests.
The question is: what do people do with the land plots? Do they keep them, sell them? Why do they split the land plots? What is their motivation? The network is an entry point into inquiring further about those persons and the land plots themselves.
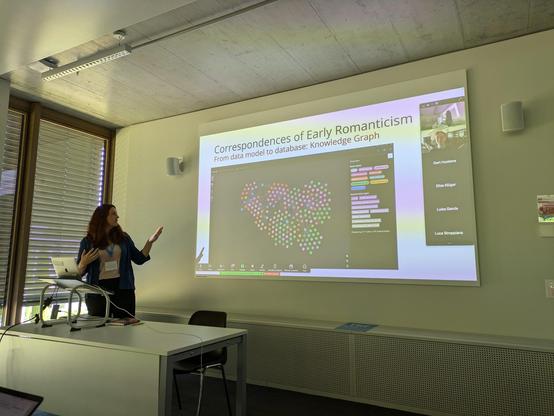
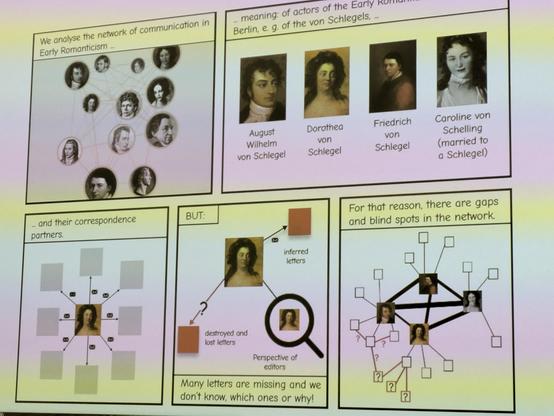
Now Elena Suárez Cronauer and Aline Deicke tell us about how they used graph comics to explore communication networks. Very exciting!
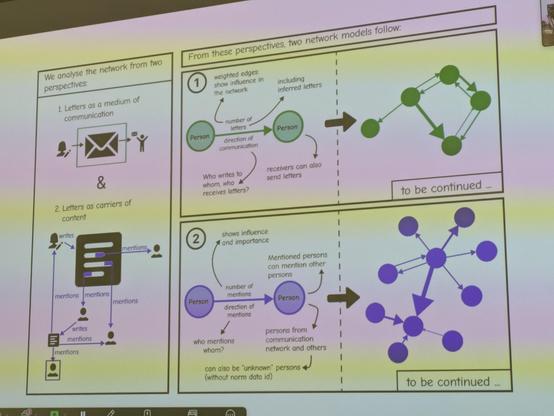
The question is: what is the dynamic within a group of authors sending letters to each other? The goal is to better understand early romanticism.
And it all starts with a knowledge graph in Neo4J, which you can see below. 💪
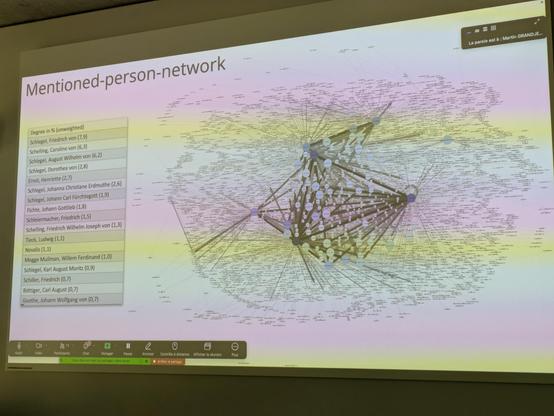
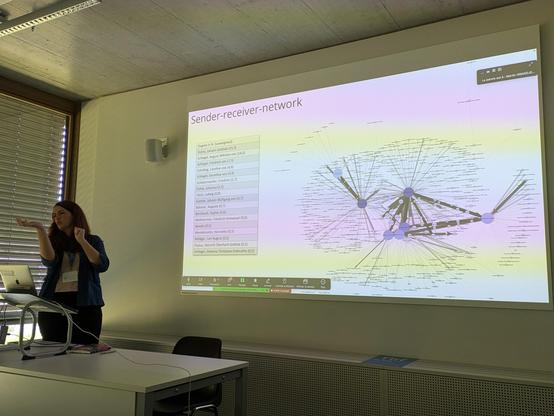
From there you can make different network visualizations such as those you can see below: who sends a letter to whom; who mentions whom...
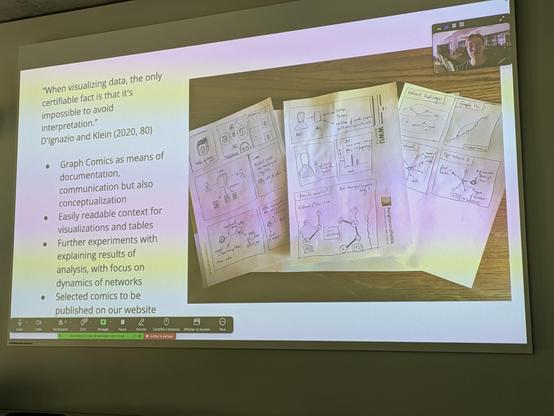
But it is difficult to communicate about the work by using these visualizations, because it lacks context. It's Haraway's "god trick" once again.
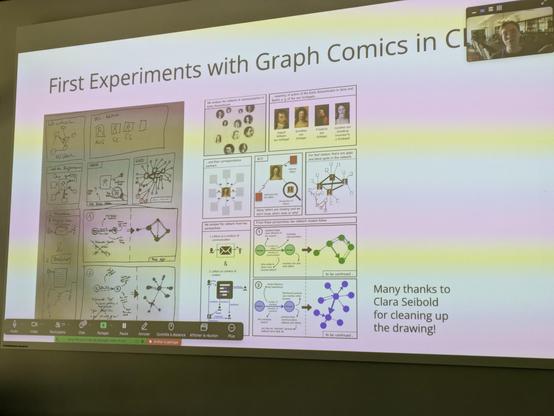
Graph comics is a solution to this issue.
Graph comics is a technique developed by Benjamin Bach.
https://aviz.fr/~bbach/graphcomics/
You have probably seen that paper, but we don't see an actual application that often. It's not easy to do!
You can see their process in those images. It is iterative, and largely manual.
Elena and Aline frame it as a matter of data feminism (following Catherine D’Ignazio and Lauren F. Klein).
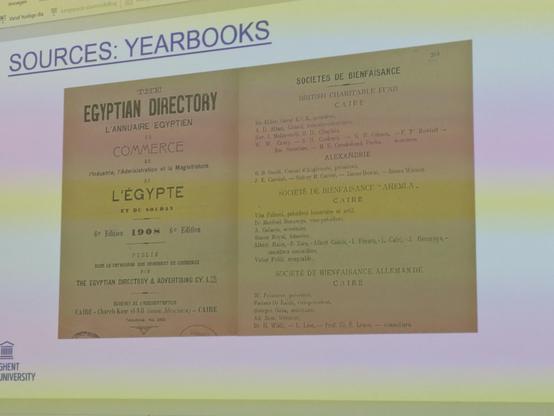
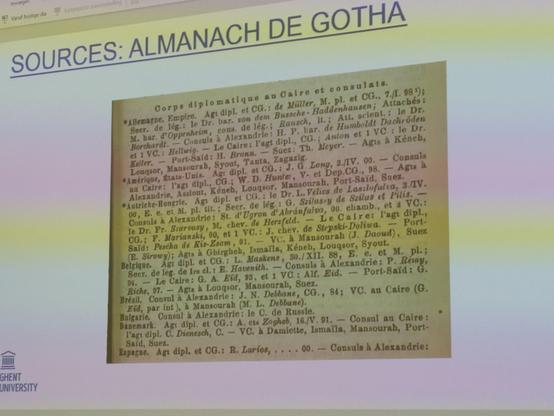
Next up is Gert Huskens with a network about "elite formation in urban Egypt" at the end of 19th century.
Elites evolve quickly due to the everchanging colonial forces in Egypt (French, British...) + an autochthonous elite + an (agro-)capitalist boom.
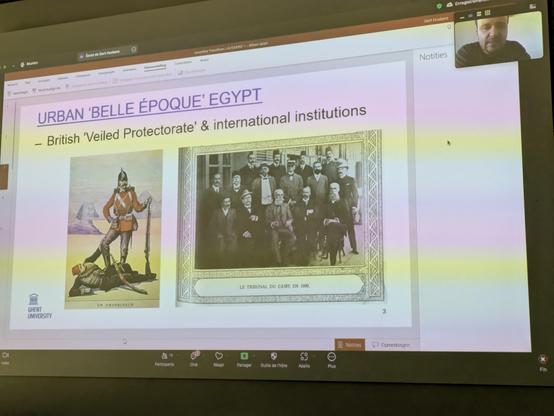
Gert looks into yearbooks, almanachs, and "livres d'or" where one can find a lot of information about elites: who gets which position, who contributes to which charity, etc.
Gert and his co-authors draw inspiration from contemporary elite studies using network analysis, e.g. Christoph Ellersgaard's work.
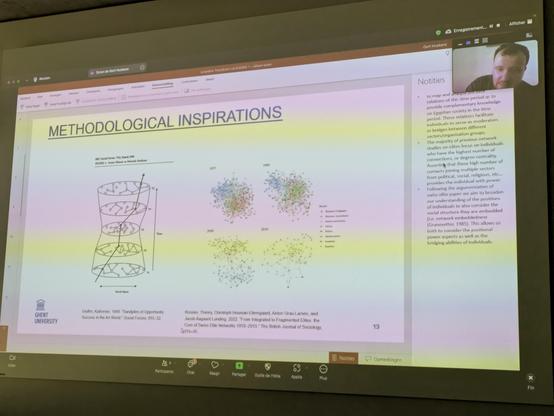
In this slides you can see the evolution of the elite network over the years.
The elites are defined by two hubs, Cairo and Alexandria. Diplomats are bridging them.
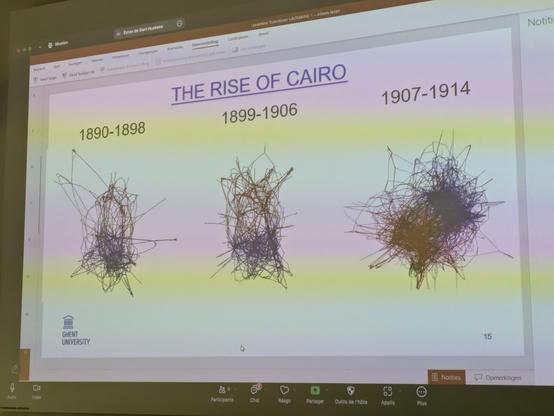
Gert is using his network maps as platforms to dive deeper into the data, and get qualitative when needed.
His inquiry is largely quali, even though the network is used as a narrative red thread in his presentation. Sometimes, it entails zooming on a detail because that's what the research demands.
So what do we learn?
* The organizations organize into a hierarchy
* The capitalist boom is the main shaping force of the elites
* The Cairo hub is gradually taking over
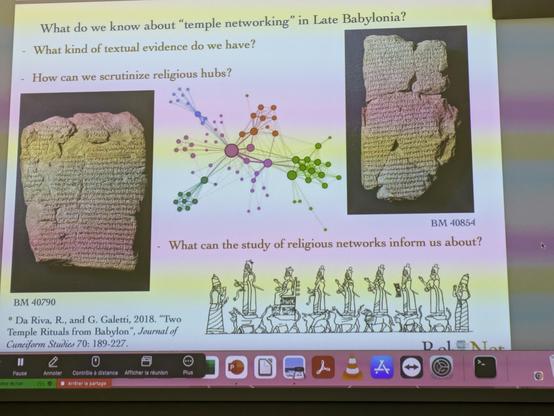
I'm back to tooting about historical network research, still with rainbow moiré pictures 🌈.
Late Babylonian period. People have tablets (clay, not Apple). They have religion. Can we learn about it by building networks? Rocio Da Riva tells us about it.
@jacomyma would be nice to link this to old law proceedings data, eg. Gazeteers like these https://gazettes.africa/ who fought whom on what...
@jacomyma thank you very much for live-tooting the conference.
@jacomyma from the abstract and the slides one could get the impression that Egypt and Egyptian elites weren’t predominantly Arabic (or Coptic or Hebrew or Amharic or Greek or indeed Ottoman) speaking … always astounding to see properly Orientalist work solely based on material in Latin script and (aspiring to be) colonial languages.
@jacomyma Thanks!!
@jacomyma @lucasrappo I wonder sometimes if HNR took the data from Sabean's Neckarhausen books or Medick's Laichingen book whether they would find something genuinely new and interesting or would just confirm in still greater detail what was already there.
@jtheibault @jacomyma
Hi! That is such a good question! The results of Sabean were the hypothesis for my PhD. For this presentation not so much. But I do find your suggestion very interesting. But: where is the data Sabean used?
Hi! That is such a good question! The results of Sabean were the hypothesis for my PhD. For this presentation not so much. But I do find your suggestion very interesting. But: where is the data Sabean used?
@lucasrappo @jacomyma Indeed that is a good question too. I assume that he still has it, though in what format I do not know. It's possible that it ended up in a data repository at UCLA, but that isn't so common for historians of that generation.
@jtheibault @jacomyma Difficult to know...
@jacomyma Common problem with DLP projectors - can often be fixed if you manually set a longer exposure time, minimum 15-20 ms.
@floe I found a way to do that, but I'm pondering whether to keep it nevertheless!
@jacomyma I love the style of that ♥️