The strain on scientific publishing 📄:

The publishing sector has a problem. Scientists are overwhelmed, editors are overworked, special issue invitations are constant, research paper mills, article retractions, journal delistings… JUST WHAT IS GOING ON!?

Myself, pablo, @paolocrosetto and Dan have spent the last few months investigating just that.
https://arxiv.org/abs/2309.15884

A thread🧵1/n

#AcademicChatter #PublishOrPerish #Elsevier #Springer #MDPI #Wiley #Frontiers #PhDAdvice #PhDChat #SciComm

The strain on scientific publishing

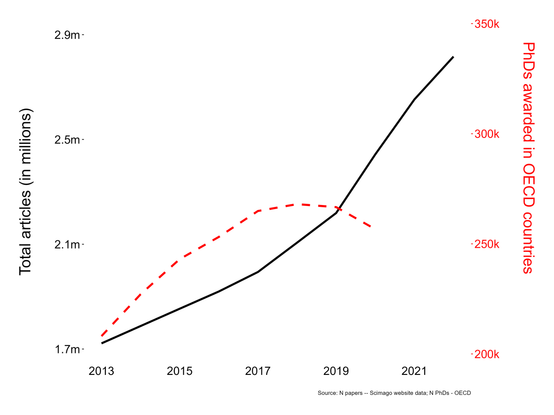
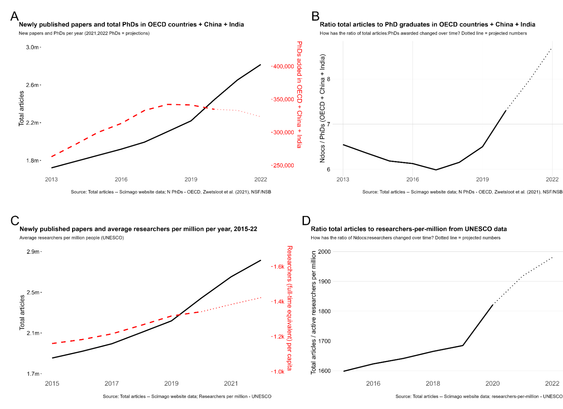
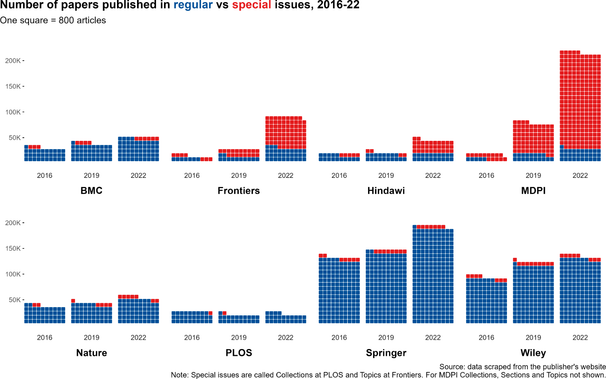
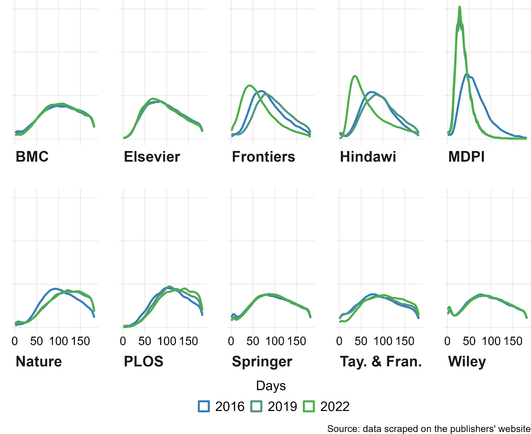
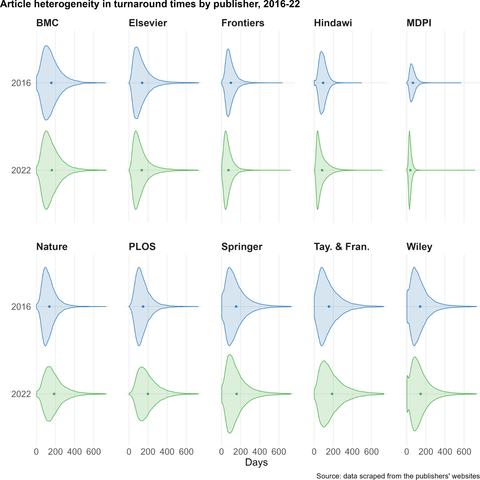
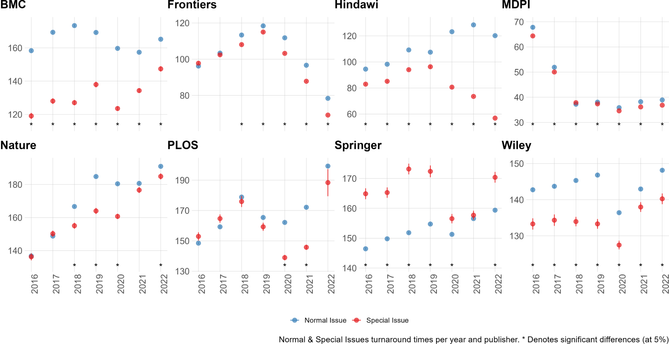
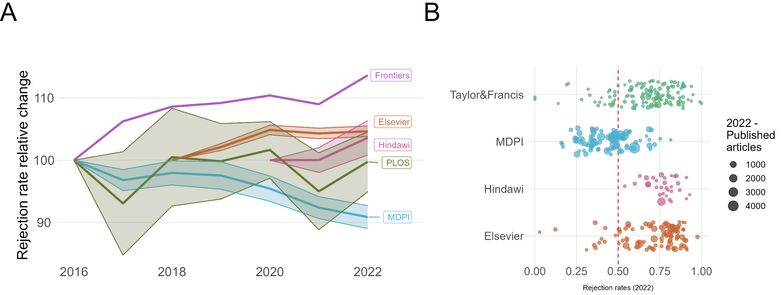
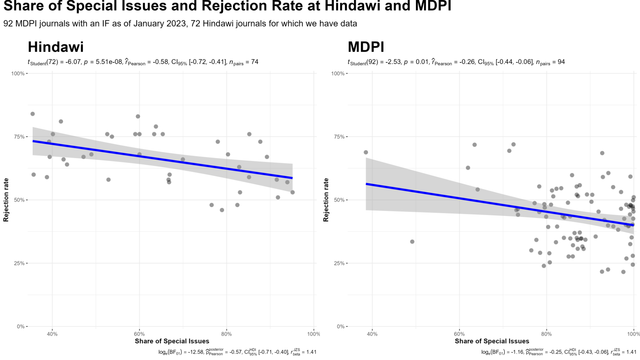
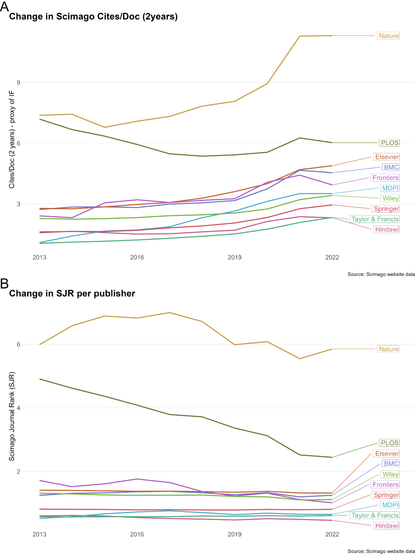
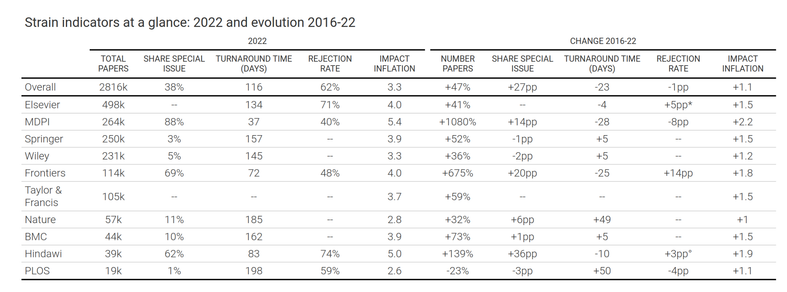
Scientists are increasingly overwhelmed by the volume of articles being published. Total articles indexed in Scopus and Web of Science have grown exponentially in recent years; in 2022 the article total was approximately ~47% higher than in 2016, which has outpaced the limited growth - if any - in the number of practising scientists. Thus, publication workload per scientist (writing, reviewing, editing) has increased dramatically. We define this problem as the strain on scientific publishing. To analyse this strain, we present five data-driven metrics showing publisher growth, processing times, and citation behaviours. We draw these data from web scrapes, requests for data from publishers, and material that is freely available through publisher websites. Our findings are based on millions of papers produced by leading academic publishers. We find specific groups have disproportionately grown in their articles published per year, contributing to this strain. Some publishers enabled this growth by adopting a strategy of hosting special issues, which publish articles with reduced turnaround times. Given pressures on researchers to publish or perish to be competitive for funding applications, this strain was likely amplified by these offers to publish more articles. We also observed widespread year-over-year inflation of journal impact factors coinciding with this strain, which risks confusing quality signals. Such exponential growth cannot be sustained. The metrics we define here should enable this evolving conversation to reach actionable solutions to address the strain on scientific publishing.

arXiv.org

First, things first: growth in articles published each year has outpaced the scientists doing the publishing. With #PublishOrPerish, we all face an ever-increasing workload (writing, reviewing, editing…). It’s been rough.

Strain itself is neutral: this could be a welcome change! Are we becoming more efficient? Are we combatting biases (academic racism, positive result bias)?

If that’s all it were, the solution to strain would be to build a better infrastructure.

But… well… it’s not. 2/n

We see that certain groups are major drivers of this article growth, in some cases seemingly out of nothingness. This includes your classic publishers like #Elsevier and #Springer, but also the upstarts #Frontiers and… most significantly #MDPI.

In numbers, there were nearly 1 million more articles per year published in 2022 (2.8m) compared to 2016 (1.9m). MDPI takes the lion’s share at 27% of that growth, with Elsevier (16%) a distant 2nd.

How did we get to this point? 3/n

I could be nuanced (it's in the preprint!). But let’s be frank: it’s special issues.

“Dear Dr ___, your preeminent work in [FIELDYOUDONTWORKIN] drew our attention to your [COPYPASTEPAPERTITLE] and we were thoroughly aroused. We invite you to submit to special issue with us, who love your preeminence. Yours faithfully, [AROUSED].”

The figure speaks for itself. With my leftover characters, instead I wanna ask y’all to send me screenshots of your favourite SI invitations! Hit me! 😀 4/n

So still… is it worth it? Strain itself is neutral. Maybe these special issues are just giving a voice to authors with less privilege?

Or maybe not. The publishers hosting special issues drastically reduced their turnaround times (TATs: submission to acceptance) - and let’s be clear, that’s INCLUDING revisions. 5/n

Now, it’s not our place to judge what an average TAT is supposed to be, but we’re very confident it’s not 37 days across all research fields. Experiment requests in fruit flies take weeks, whereas mice will take months.

TATs are also supposed to vary from article to article: some articles are great on 1st draft, some need a little TLC, and some need… a lot… Yet #MDPI journals in particular, across the board, accept everything in a blistering 37 days with almost no variation. 6/n

But it’s not just #MDPI: #Frontiers and #Hindawi also grew their share of special issues. One might argue: “These are just labels publishers use. The peer review process is the same.”

Au contraire mon ami : no it’s not. Special issues have lower TATs. They’re intended to be lax. They’re for authors to voice ideas that could turn out to be wrong, but advance the conversation in the field. That’s what they used to be at least… and what made them “special.” But I digress… 7/n

We also looked at rejection rates (RRs), with some caveats: we took a publisher’s word at what their RRs were, and don’t know underlying methods. But we figured RRs will at least be calc’d consistently within groups. We compared relative RRs over time and RRs compared to proportions of special issues.

Again, #MDPI was the maverick, with a unique decline in RRs over time. Not only that, but in both #Hindawi & MDPI, more special issues means lower RRs. The review process *is not* the same. 8/n

Lastly let’s talk #ImpactFactor (IF). Reminder: IF = avg cites/doc articles in a journal receive within 1st 2y. IF values total cites.

IFs are going up 📈: they’re literally being inflated like a currency. So if you see a journal celebrating its year-over-year increase in IF, you’ve gotta normalize for inflation. This inflation accompanies the huge crush of special issues from earlier. But(!) a citation network-adjusted rank (Scimago Journal Rank, SJR) hasn’t changed accordingly. What gives? 9/n

@MarkHanson

Your IF calculation is slightly off: you don't devide just by 'articles', but by the articles the publisher negotiated with WoS are 'citable':
https://bjoern.brembs.net/2016/01/just-how-widespread-are-impact-factor-negotiations/

This means there is IF inflation built in and it has been known for decades (need to dig out references) that IF tends to scale with journal size.

Just how widespread are impact factor negotiations?

Over the last decade or two, there have been multiple accounts of how publishers have negotiated the impact factors of their journals with the “Institute for Scientific Information” (ISI), both before it was bought by Thomson Reuters and after. This […] <a class="more-link" href="https://bjoern.brembs.net/2016/01/just-how-widespread-are-impact-factor-negotiations/">↓ Read the rest of this entry...</a>

bjoern.brembs.blog

@brembs Thanks! On those refs, IF has also been shown to decline following rapid growth (eg for PLOS ONE), so it's not so clear cut. One of our colleagues commented that our IF inflation observation doesn't make sense given past literature (refs), and sounds like you're saying the opposite.

In response to both sides, see Fig5supp figures where we took great care to break down the factors leading to the inflation we're seeing between 2016-2022.

@MarkHanson

The references I was refering to are actually older and I also noticed the mega-journals not working as a perfect replicate of the older references 😆

So, yes, it is probably not completely clear-cut. Given the median/mean situation, the scaling with article number makes some intuitive sense, but there may be (nonlinear?) situations where this does not hold?

@brembs I mean my honest take is just that journal citations/document increased from 42->45 over 2018-2021, and then on top of that all these mega journals are pumping out articles like crazy, and the combination has created an imperfect storm of more citations output + more documents = over literally all journals there is an inflation of IFs.

We also broke down journals by size and that's not part of it. Not sure we ever did medians... but we probably should!

@MarkHanson

In biomedicine, one can see huge inflation due to the pandemic. It may be a big enough signal so you see it generally? Can you tease that out? My suspicion is that it should jump out at you?

@MarkHanson

Phrased differently, if you account for pandemic publications and citations, how much of an effect is left?

@brembs See Fig. 5supp3 where we discuss the impact of COVID-19!

Long story short: 2023 data will give a better view.

The growth in references per article began with the rise in SIs in 2018, which predates the pandemic. And then in 2022, despite many relaxations and people getting back to wet lab work, we still saw growth (but a reduced rate). If it was ALL COVID, we'd have expected a return to normalcy, not a further increase (even if reduced growth). So quantifying best awaits 2023 data...

@MarkHanson

Interesting! Yes, makes a lot of sense to wait. Would be interesting to tease out how much of the growth is coming from where!