The Atlantic Meridional Overturning Circulation (AMOC) is probably affected by the present climate change, but the existence and amplitude of the long-term trend remain a subject of debate:
https://www.nature.com/articles/s41561-022-00896-4
Luckily, the recent geological past provides another way to study AMOC fluctuations. The AMOC was particularly variable during the last glacial cycle, in apparent synchrony with temperature records from the North Atlantic and Greenland, notably their abrupt variability. (2/20)
Atlantic circulation change still uncertain - Nature Geoscience

Nature
These abrupt temperature changes, named Dansgaard–Oeschger (DO) events, also have Southern Hemisphere (SH) counterparts via the thermal bipolar seesaw, a concept describing the meridional heat transport leading to asynchronous temperature changes between both hemispheres.
Several abrupt DO cooling events, named DO stadials, are accompanied with massive releases of icebergs into the North Atlantic, named Heinrich (H) events, as well as drastic slowdowns or even shutdowns of the AMOC. (3/20)
Previous bipolar seesaw studies mostly relied on ice cores from Greenland and Antarctica, given the high temporal resolutions and synchronized chronologies of their derived records. However, ice-core–based temperature records from Greenland do not show enhanced DO coolings during H events, contrary to sea surface temperature (SST) records from the Iberian Margin. Therefore, Greenland and Antarctic ice cores alone cannot provide a complete picture of the bipolar seesaw. (4/20)
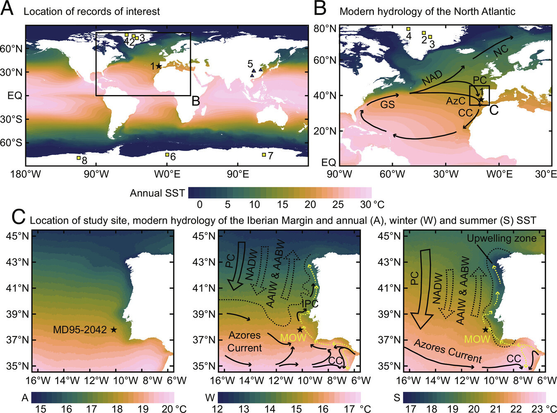
Here we present and use a high-resolution SST record based on a recent GDGT ring index (RI-OH′) from a famous Iberian Margin site (MD95-2042), in comparison with other SST records from the same Iberian Margin site.
The other Iberian Margin SST records used for comparison include established climate proxies such as UK'37, planktic foram d18O, and benthic foram d18O.
We also build and use Antarctic stacks as SH reference records. (5/20)
RI-OH′ reflects the degree of cyclization, i.e. the number of rings, of the involved archaeal membrane lipids (OH-GDGTs) as a mechanism to regulate their fluidity/viscosity.
Our Iberian Margin RI-OH′ SST record faithfully shows DO events with contrasting cooling amplitudes between DO stadials with and without H events.
OH-GDGT-based paleothermometry truly has a future!
See also Davtian et al. (2021) in Paleoceanography and Paleoclimatology:
https://doi.org/10.1029/2020PA004077 (6/20)
One way to study the bipolar seesaw is to correlate SH warming amplitudes with Northern Hemisphere (NH) cooling durations, i.e. the classical diagram. Indeed, several previous bipolar seesaw studies obtained strong correlations using ice-core–based temperature records from Greenland and Antarctica.
While we obtained strong correlations as well, our Iberian Margin SST record gives the best linear regression fits. (7/20)
We also use the thermal bipolar seesaw model by Stocker and Johnsen (2003) in Paleoceanography and Paleoclimatology to generate synthetic SH temperature records, with NH temperature records as model inputs:
https://doi.org/10.1029/2003PA000920
Indeed, Iberian Margin SST records have a sufficient resolution for this use. (8/20)
While all selected NH paleothermometric records give good SH temperature simulations, both biomarker-based Iberian Margin SST records give better SH temperature simulations than do ice-core–based paleothermometric records from Greenland. Both biomarker-based Iberian Margin SST records better simulate enhanced SH warmings during DO stadials with H events than do ice-core–based paleothermometric records from Greenland, notably during the second half of the last glacial cycle. (9/20)
Therefore, SST records deserve attention as well to study the thermal bipolar seesaw, despite their low temporal resolutions compared with ice-core–based paleothermometric records from Greenland and Antarctica.
See also Anderson et al. (2021) in QSR for a parallel consideration of SST records from the Southern Ocean and ice-core–based temperature records from Antarctica:
https://doi.org/10.1016/j.quascirev.2021.106821 (10/20)
To make the most of the contrasting cooling amplitudes between DO stadials with and without H events recorded by our Iberian Margin SST record, we propose two extensions of the classical SH vs NH diagram.
To obtain both extended SH vs NH diagrams, we calculate two products that involve NH cooling amplitudes and are proportional to heat transfers between both hemispheres during each DO stadial. (11/20)
Our first extended SH vs NH diagram is elegant because it has the same physical basis as the classical one, but with a relationship that depends only on the time characteristic of the #heat reservoir rather than the product of this parameter and NH cooling durations. Accordingly, this extended SH vs NH diagram gives strong correlations as well. (12/20)
Our second extended SH vs NH diagram not only gives even stronger correlations, but also has regression slopes that would reflect the heat distribution between both hemispheres. We thus derive the Bipolar Seesaw Index (BSI) from this extended diagram. The BSI is the distance along the regression line from the origin. (13/20)
Our BSI differentiates DO stadials with and without H events. Yet, BSI values form a continuum rather than only two clusters, which may support the existence of at least three climate states during the glacial or even a continuum of thermal bipolar seesaw responses. (14/20)
Overall, we show that Iberian Margin SST records better confirm the thermal bipolar seesaw than do ice-core–based paleothermometric records from Greenland using SH vs NH diagrams, data-model comparisons, and the BSI.
Indeed, DO coolings during H events are "truncated" in Greenland but not off the Iberian Margin. The extended sea ice cover and southward shift of AMOC convection zones likely isolated Greenland, but not the Iberian Margin, from North Atlantic coolings. (15/20)
Importantly, North Atlantic conditions define SH responses, including within the Southern Ocean. Our second extended SH vs NH diagram and derived BSI reveal a climate system more complex than a simple flip-flop between two constant states when a threshold is exceeded.
Our work suggests a richer dynamic than was previously thought, which has direct implications for our understanding of past and future climate changes associated with the AMOC and the thermal bipolar seesaw. (16/20)
Hopefully, our study would stimulate a parallel consideration of North Atlantic and Southern Ocean SST records and high-resolution ice-core–based records, in order to study the tipping points linked to the AMOC in the ocean–atmosphere–ice system. (17/20)
I thank my former PhD and postdoc supervisor Edouard Bard (Collège de France and CEREGE) for the Contributed submission as a (foreign) member of the National Academy of Sciences.
Many thanks to Jerry McManus (Columbia University), Eelco Rohling (Australian National University), and Thomas Stocker (Universität Bern) for the constructive reviews. (18/20)
For your information, I am aware of this provocative post:
https://getsyeducated.substack.com/p/pnas-is-not-a-good-journal
Please follow the recommendation stated in the final sentence of this post. Please evaluate our bipolar seesaw study itself rather than its package.
Thank you for your attention! (20/20)
PNAS is Not a Good Journal

(and Other Hard Truths about Journal Prestige)

Get Syeducated

@nina_davtian Regarding this blog post: a high impact factor means that many people see the papers published there.

Nothing more, but also nothing less: getting published there means that you influence a lot more people. Which is a good thing if you have found something many people can benefit from.

@nina_davtian what do the gray crosses represent?
@ArneBab
Gray crosses are DO stadials without H events. The other symbols (triangles and squares) are DO stadials with H events. The main difference is the occurrence (with H events) or not (without H events) of massive iceberg discharges into the North Atlantic during NH abrupt cooling events.