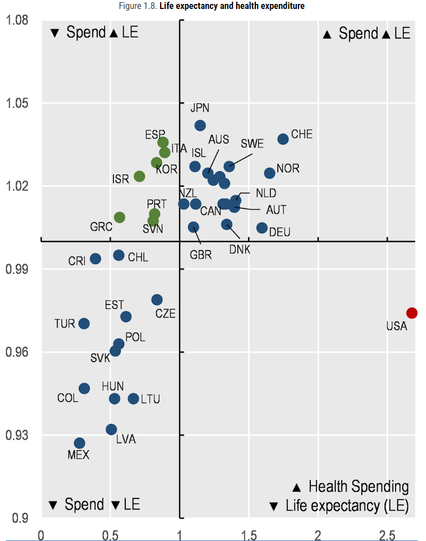
Here's a scatterplot of health spending per capita (x axis) and life expectancy (y axis) in OECD countries. The lines represent averages.

One country sits alone in the bottom right quadrant due to its much higher health spending and below-average life expectancy.

Source: https://www.oecd-ilibrary.org/sites/ae3016b9-en/1/3/1/index.html?itemId=/content/publication/ae3016b9-en&_csp_=ca413da5d44587bc56446341952c275e&itemIGO=oecd&itemContentType=book

Home

OECD's dissemination platform for all published content - books, podcasts, serials and statistics

Best health outcomes (based on wide range of data)
1 Iceland
2 Norway
3 Netherlands
4 Luxembourg
5 Australia
6 Finland
7 Switzerland
8 Sweden
9 Italy
10 Andorra
11 Ireland
12 Japan
13 Austria
14 Canada
16 NZ
18 Germany
23 UK
28 Czech Republic
29 US
48 China
55 Cuba
66 Iran
91 Mexico
127 S Africa
145 India
168 Haiti
194 Somalia
Source: https://www.thelancet.com/journals/lancet/article/PIIS0140-6736(18)30994-2/fulltext
Canada 14, France 20 😲
@conradhackett This is from 2018. All is different now after Covid especially in the Netherlands
@Marielvd @conradhackett wouldn’t it be equally different for every country after covid?
@conradhackett @teachpaperless That could be the case. But particularly in The Netherlands the problems with waiting lists to get hospital care and the staff shortages are extreme since Covid. More than 120.000 people are on waiting lists to get surgery or treatment
@conradhackett we can strive for parity with the Czech Republic
@conradhackett Surprised UK cracked the top 200 tbh...
@conradhackett USA: Not great, not terrible
@conradhackett Canada's healthcare is in crisis at the moment, it's scary, don't get sick need surgery or a biopsy right now
@conradhackett quite surprised to see Australia so high as we currently have very significant shortages of nurses, doctors & have had increasingly longer response times with ambulances. Regional healthcare is especially struggling.
@conradhackett they clearly didn't factor in all the freedom and amazing profitability that comes with the US system...
@conradhackett I’m thinking socialized medicine, family leave, job equality for women and an ethnically homogeneous society.
@conradhackett a bit of American exceptionalism
@oakster @conradhackett How much of the USA’s position is attributable to gun violence?
@conradhackett @RockerDoc surely almost nothing. It doesn’t change the expense side of the equation, just life expectancy. And I’d still say that’s small. Very small. The numbers to find that out should be easily available

@oakster @conradhackett @RockerDoc

Rocker > American Hospital Association estimated gun violence cost hospitals $1,000,000,000 annually for 2016-2017. Add 20% for doc fees.

In 2020, total health care costs were $4,000,000,000,000.

Gun violence is an insignificant contribution to total costs.

WHY CAN’T I PASTE ANYTHING in iOS app?????

@kegill I switched to MetaText due to iOS pasting problems in the default client. Fwiw.
@kegill Interesting, much higher than I would have guessed. Although even if you eliminated that entirely the health expenditure would still be above any other country (75% of ~2.6). Of course, the effect on life expectancy would also matter. Seems not a negligible factor but not a major one. (what counts as major?)
@oakster @conradhackett @kegill Lots of young deaths from guns => many years of life lost. So I’d expect a far bigger impact on mortality (and thus life expectancy).
@RockerDoc @conradhackett @kegill I agree that as a cause of death guns have a larger effect than many substantial other causes

@RockerDoc @oakster @conradhackett

Life expectancy has dropped dramatically since 2019 due to Covid. It’s comparable to influenza in the ‘20s.

From 2020-21, US life expectancy dropped from 77.0 to 76.1 years, the lowest since 1996. “The 0.9 year drop in life expectancy in 2021, along with a 1.8 year drop in 2020, was the biggest two-year decline in life expectancy since 1921-1923.”
https://www.cdc.gov/nchs/pressroom/nchs_press_releases/2022/20220831.htm

Life Expectancy in the U.S. Dropped for the Second Year in a Row in 2021

National Center for Health Statistics

@RockerDoc @oakster @conradhackett

In 2017 & 2018, firearms accounted for more individual years of potential life lost (YPLL) than motor vehicle crashes.

“Traumatic injuries remain the leading cause of death in the USA for individuals up to the age of 46 years.”

2018: 1.42 million v 1.34 million YPLL
38,929 firearm deaths
White males, suicide (4.95 million YPLL, 2009-2018)
Black males, homicide (3.2 million YPLL, 2009-2018)

https://tsaco.bmj.com/content/7/1/e000766

Firearms: the leading cause of years of potential life lost

Objectives Data from the Centers for Disease Control and Prevention (CDC) show that firearm deaths are increasing in the USA. The aims of this study were to determine the magnitude of potential years of life lost due to firearms and to examine the evolution of firearm deaths on the basis of sex, race, and geographical location within the USA. Methods Data was extracted (2009–2018) from the National Vital Statistics Reports from the CDC and the Web-based Injury Statistics Query and Reporting System database. Years of potential life lost was calculated by the CDC standard of subtracting the age at death from the standard year of 80, and then summing the individual years of potential life lost (YPLL) across each cause of death. Results The YPLL in 2017 and 2018 was higher for firearms than motor vehicle crashes (MVCs). In 2018, the YPLL for firearms was 1.42 million and 1.34 million for MVC. Males comprised the majority (85.4%) of the 38 929 firearm deaths. White males had the most YPLL due to suicide, with 4.95 million YPLL during the course of the 10-year period; black males had the most YPLL due to homicide with 3.2 million YPLL during the same time period. The largest number of suicides by firearms was in older white males. Firearm-related injury deaths were highest in the South, followed by the West, Midwest, and Northeast, respectively. Conclusion Firearms are now the leading cause of YPLL in trauma. Firearm deaths have overtaken MVC as the mechanism for the main cause of potential years of life lost since 2017. Suicide in white males accounts for more YPLL than homicides. Deaths related to firearms are potentially preventable causes of death and prevention efforts should be redirected. Level of evidence Level III—Descriptive Study.

Trauma Surgery & Acute Care Open
@RockerDoc @oakster @conradhackett I was actually wondering about this as well, how much does an increase in avoidable mortality lower life expectancy? Did not see a clear answer in the paper but I am sure that it has been looked at before.

@conradhackett

The graph doesn't distinguish between - for the USA - over priced healthcare or a healthcare system struggling to counter appalling lifestyle (too much sugar, processed foods etc.)

@conradhackett

It clearly shows how much the USA is an outlier relative to the other (western) european countries.

The causes are well known, but bringing this in line seems to be very hard for USA politicians.
Or are they listening more to lobbyists and companies than civilians.

@conradhackett As someone who is a caregiver for my Cystic Fibrosis / Post-Transplant / Transplant Rejection sibling, I could list the inefficiencies in the system. It is mind-boggling. Truly.
@conradhackett
If we don't let poor people die from lack of healthcare, who will the Christians feel superior to?
@conradhackett all of that empty space around them is full of profits for the ghouls though!
@conradhackett It doesn’t matter how advanced our healthcare is if we have to use GoFund me to pay for insulin.

@conradhackett
For the life of me, I do NOT understand why this isn’t (a) common knowledge and (b) sufficient reason for major overhaul.

I was thinking about health care earlier today when pondering the nature of public goods. One characteristic is that duplication leads to greater social cost (think “infrastructure”). Are hospitals (equipment, ER, beds) infrastructure? I think an argument could be made that they are. (Have not run numbers.)

@conradhackett I imagine that money spent on health care lobbying (probably latent variable) has a negative effect on life expectancy
@conradhackett A cause-by-cause analysis that may provide some insight into why average US life expectancy is below average. https://ourworldindata.org/us-life-expectancy-low
Why is life expectancy in the US lower than in other rich countries?

Americans have a lower life expectancy than people in other rich countries despite paying much more for healthcare. What factors may explain this?

Our World in Data

@infinimatt @conradhackett
Puzzling to throw "obesity" in as a cause of death akin to homicide, opioid overdose, and road accidents. Obesity isn't a cause of death, and its measurement and attribution to mortality is fraught to say the least. A cross-national comparison of "death rate from obesity" is going to be far from reliable, most likely mixing in issues of systemic racism, sexism, and classism.

As data analysts we have to be careful with our measures and think about the social context

@conradhackett

The same life expectancy in Czech Republic (with its unhealthy fat/pork/dumplings/beer/and more beer...diet) and USA.

But USA have to spend about 2,5x more 😱💸

@conradhackett The UK Left as self appointed defenders of “our NHS” (producer not user, inputs not outputs focused) always use US system to beat any attempt at (overdue) urgent reform over the head, but of course there are many good Alt system - Swiss/Singapore my favs …
@conradhackett
When we speak of #innumeracy in #AmericanEducation, we often speak of the inability of citizens to read a graph. It's math illiteracy.
As a retired math educator, I'm calling the #USHeathcareSystem expense v outcome debacle as an example of citizen innumeracy.
I'm glad to report that it is generational, and that younger folk can read this graph.
#UniversalHealthcare
@urbanhiker @conradhackett It is a well known fact that you can not treat US as one country. If you take the Caucasian population (and probably the Asian as well) you are in the top right corner, for Latinos and black (you are probably in the Center on spending but at the level of Haiti on LE).
@arneelof @conradhackett Yes, Arne, you are correct about the different life expectancies for different groups.
I'm focused on #PublicPolicy to improve outcomes for all at reasonable prices for all. The graph is a good attention-getter.
@conradhackett partner and I both work/worked in healthcare in the US and this is shameful
@conradhackett Would love to see Asian countries against this, esp. China and Thailand
@conradhackett I am very glad that you explained what the axes represent in your toot. The labelling on that graph is very confusing.