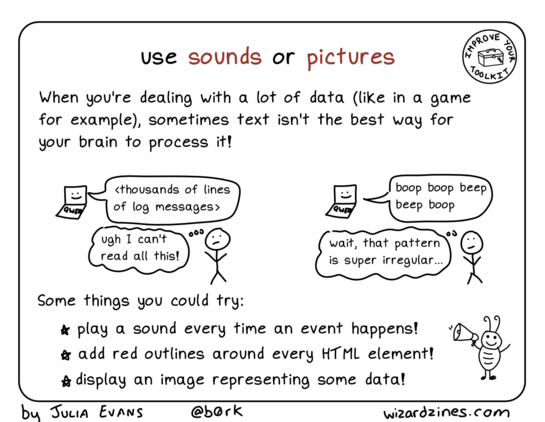
debugging strategy: use sounds or pictures
I'm still not super satisfied with the examples in this one, I'd love to hear examples of how you use visualizations or sounds to debug
debugging strategy: use sounds or pictures
I'm still not super satisfied with the examples in this one, I'd love to hear examples of how you use visualizations or sounds to debug
@b0rk famously the #haskell GHC compiler offers an option to make the computer beep at the start of a major garbage collection https://downloads.haskell.org/ghc/latest/docs/users_guide/runtime_control.html#rts-flag--B
From that link:
“Some people here use it for a variety of purposes—honestly!—e.g., confirmation that the code/machine is doing something, infinite loop detection, gauging cost of recently added code. Certain people can even tell what stage [the program] is in by the beep pattern. But the major use is for annoying others in the same office…”
Graphs - particularly multiple line graphs over time with a shared time bar so you can drag the bar on 1 graph & see what other values were on other graphs at the same time. Great for finding correlations.
Also flame graphs for finding slow/error causing components. Lightstep is a company that does this well.
@b0rk I remember coming across “audioization” (sp?) in ‘00s era Agile or XP book. Something about assigning different tones or instruments to different events. I haven’t found too many actual examples of this it tools/libraries to help.
It’s one of those things that makes me wish I knew music theory or composition better. I’d love to pipe our real time logs/metrics in one end and get a soundscape out the other and feed it into a Slack huddle.

@b0rk If you naïvely interpret certain forms of binary data (e.g. a stream of integers) as raw PCM audio data, certain patterns can pop out more easily due to the… alternate… pattern matching machinery used by the brain. Anything like a repeating pattern, or distinctly different period of pattern, can highlight interesting points.
Fun facts: you can use JPEG to compress PCM, and you can use MP3 to compress images. The artifacts are very similar, due to the signal processing (DCTs, &c.) used.
@b0rk Ah, and to follow up with a far more practical example of visually breaking something down, let me introduce x-ray CSS: https://gist.github.com/amcgregor/71c62ea2984839a9063232ed2c0adf27#file-xray-css
Example: https://codepen.io/amcgregor/details/PoZoPYv
More complete Facebook login page (defused) example: https://codepen.io/amcgregor/details/jOWObBM

My own HTML5 boilerplate sans most of the code. Because there's too much Romulus-be-damned boilerplate, and people fail to realize almost none of it is in any way needed. For more details tha...
Thank you for this!
This whole thread is blowing my mind. I can't believe I never thought about using Hi-Fi sound to sift through large amounts of data before. I mean beyond beeps and boops.
Our brains have all this built in machinery for finding or hiding patterns in audio data. I can hear 24 simultaneous sounds* much easier than I can look at 24 simultaneous pictures.
Where can I read more?
*(8 musical instruments, left, center, right channels).
@alice @b0rk if I had to find a pattern in a large messy pile of data, especially if I didn't know what I was looking for, my instincts would be to either visualize the data, or use math (clustering, searching, pattern recognition). I wouldn't have thought to consider converting it to some form of audio, but it makes so much sense as a potential option now that you point it out.
I know our brains don't do FFTs, but the net effect is similar.
@mekkaokereke @b0rk There are a number of ways to map data to sound. Time-series data makes the connection more obvious, but here's an example (mild flashing and loud tones warning) that uses the "value" being read (for comparisons, initially, then for confirmation at the end) as the frequency shift.
You can absolutely hear the difference between these algorithms. You can even intuitively pick up that some… are not optimal.

@b0rk in another project I used xvcg to visualize and debug the AST internal representation in a compiler.
And in radio work it's always useful to look at a spectrogram or even listen to the radio waves transposed into sound frequencies. It sounds just like noise initially, but with some training, people can get quite good at spotting unusual patterns, and you can get a lot of information in a small space or time
@b0rk When working on the multi-process project for #Firefox, I built an add-on that played a Geiger counter tick sound every time our code used a slow pathway called a "cross-process object wrapper". That, and frequency logging, helped us prioritize which CPOWs to remove first.
I wrote about that here, and mentioned the add-on that plays sound at the end:

@b0rk pictures are great
at a previous job, our app had an interface that asked users branching questions to get the right info for what they were trying to do, and it was fragile and high flux
i added a GraphViz collector that dumped to debug logs the state of the UI as a directed graph, color-and-thickness-coding the question types and the user's path through the app
most popular debugging tool on my team, and the best part was that other people started adding more info to it
@b0rk I haven't deliberately added sound for debugging, but.
One system I work on controls a radar antenna. That radar antennas motors are audible from the control room where I run my tests. I've frequently looked up when the motor sound alerted me that the automation was going awry. Or sometimes I can even tell what stage the computation has gotten to because of that sound. "We must be in track--I hear the motors carefully following something".
@b0rk
A bit related: the work monorepo takes a long time to <<rm -rf node_modules && npm i>> and I had to do it a lot as I upgraded versions of a key package
<<rm -rf node_modules && npm i && say -v Karen "install done">> meant that I could stop being distracted and get back to it right away
@b0rk I posted some video clips years ago when I was doing my first game jam: https://mastodon.social/@cincodenada/99905016639802540
https://mastodon.social/@cincodenada/99904225932817327
For reference, I'm very much not a game dev by trade, I've done mostly webdev and backend, but I still landed on visual debugging pretty quickly, because as you say, it really is often the best tool!

@b0rk Other have already mentioned charts, and I'm a big fan of those as well! I've solved some very tricky performance problems over the years by pulling numbers out of logs and plotting them. My workslacks are always littered with charts I've made, below is one trying to debug why two different clients were getting very different download experiences.
Flamegraphs are another great example of taking debug output that is natively text and visualizing it to make it infinitely easier to grasp, to the point that they're now built in to the major browser debugging tools: https://www.brendangregg.com/flamegraphs.html

@b0rk Yes, flamegraphs, my beloved! I figured you'd likely heard of them, but I didn't think of them as being in this category until I stumbled across a screenshot of one looking through my other charts and was like OH OF COURSE 😀
(Also, I initially screwed up the link to the thing the rectangles were for, fixed it with the shiny new edit button yay!)
@b0rk Btw, I love the inclusion of sound here, I was thinking about that and remembered this representation of Wikipedia edits as sound that you may well have already run into: http://listen.hatnote.com/
And while it may not have been intended as a debug tool, I've heard from a friend who works in ops at Wikimedia that they sometimes keep it up in the background, especially during big rollouts/updates. It's fun _and_ helpful to have an overall audio sense that the edits flowing as usual (or are tapering off or coming back in the case of planned maintenance).
@b0rk
“Steve Hayman has a winner with his audio ping script.
If there were the equivalent of an Oscar for innovative use of
NeXT and Unix tools, I would nominate Steve.”


