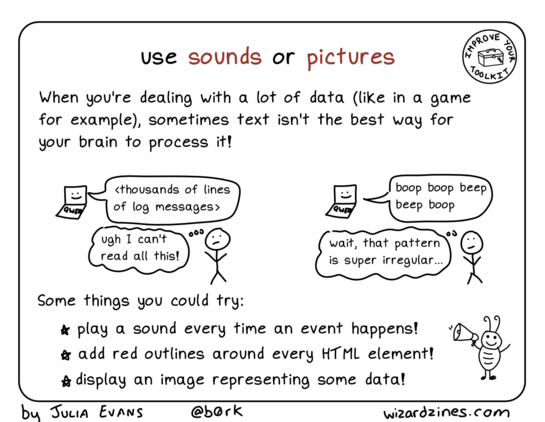
debugging strategy: use sounds or pictures
I'm still not super satisfied with the examples in this one, I'd love to hear examples of how you use visualizations or sounds to debug
debugging strategy: use sounds or pictures
I'm still not super satisfied with the examples in this one, I'd love to hear examples of how you use visualizations or sounds to debug
Graphs - particularly multiple line graphs over time with a shared time bar so you can drag the bar on 1 graph & see what other values were on other graphs at the same time. Great for finding correlations.
Also flame graphs for finding slow/error causing components. Lightstep is a company that does this well.
