Do you use #ncview to quickly browse your #NetCDF files?
You are not the only one !
Of course, a problem with #ncview is that it comes with bad #colormaps, including many 🌈 rainbows 😭 .
But we have a solution for you !
So here comes a little challenge:
Step 1) install #ncmaps (https://github.com/TomLav/ncmaps). Really easy.
Step 2) make a #ncview screenshot of a #NetCDF file using one of the ncmaps colormaps.
Step 3) Post it here below, explaining what the image shows, and naming the colormap used.
I'll #boost your contribution 😊!
@lavergnetho I first take this opportunity to thank you a lot for the colormaps! I use them for a long time and it's a life changer.
Attached is a screenshot of a climatology of the Stratification Control Index (simplified explanation: red = stratified by temperature, blue = stratified by salt)
We have 2 papers that use the SCI (plus other in prep), don't hesitate to read them!
http://dx.doi.org/10.1126/sciadv.abq0793
https://doi.org/10.1175/JPO-D-21-0295.1
@TGuinaldo Cheers Thibault for this nice example!
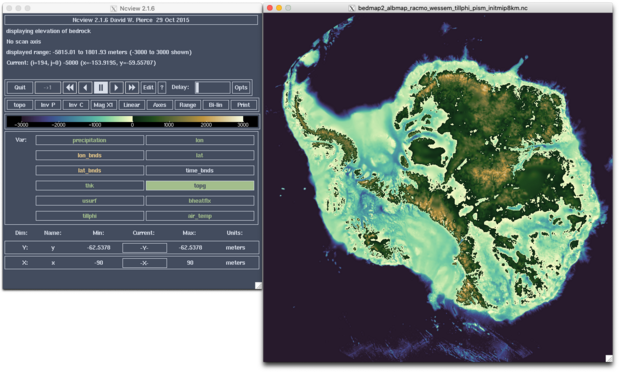
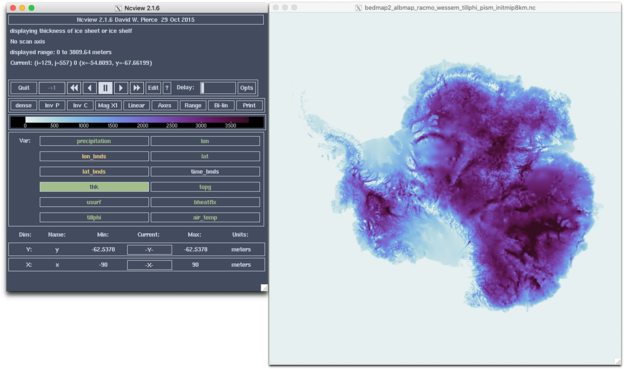
@lavergnetho #ncmaps is definitely the best update to #ncview since 2017! I use it for quite some time now and don’t want to miss it anymore. Giant thanks for taking the pain out of ncview and even more for making this eye-candy solution publicly accessible!
Screenshots below show present-day #Antarctic bed topography and ice thickness from the #Bedmap2 dataset using colormaps topo and dense from #cmocean.
@juliusgarbe Thanks for the kind words, Julius! And a very nice use of #ncmaps indeed.
We also have to thank the original developers of #ncview: they thought ppl would want to add more colormaps and made it possible without compiling the code.
@lavergnetho Here's mine Thomas 😀 It's sea surface temperature in the southwestern Mediterranean Sea, showing, what else 😅 , a wonderful Alboran gyre and a filament east of it, with missing data reconstructed with #DINEOF. I have tried the Roma colormap this time.
Thank you so much for this!!
