🌬️
🌬️
Seattle Torrent has the most minty fresh logo. Not sure whether toothpaste or dishwasher detergent yet though. #pwhl #pooptoots #SeattleTorrent
today was the twins’ “18-month” health check at city hall (that they telephoned to offer me last week) and everything went well ✨ in fact the whole day was pretty good right up until toddler bedtime when some exploding nappies resulted in me having to get changed out of my pyjamas and am now instead in the japanese equivalent of basically-underwear (inner shirt and leggings) because i have no more suitable sleepwear  #pooptoots
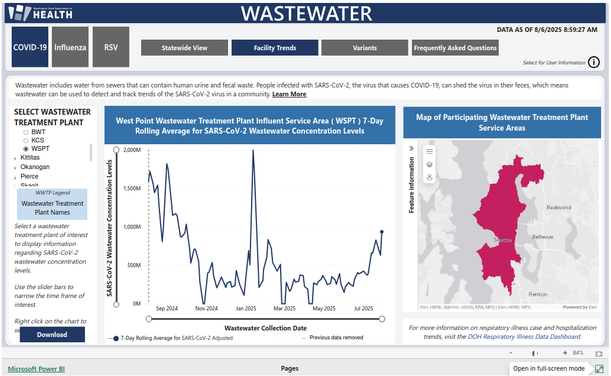
#pooptootsWelp, I'm a day late on #pooptoots. Everyone, the (delayed) weekly #washingtonstate #kingcounty (that is, #seattle and environs) #COVID #COVID19 #wastewater toot-fest.
A quick reminder that this King County respiratory disease data comes from Washington State, not the federal government.
The West Point (WSPT) sewage treatment plant's 7-Day running average of the Sars-CoV-2 levels is up to levels we haven't seen since the beginning of the year. Last data is from 7/28. The XFG/XFC and NB 1.8.1 variants are here, in all three sewersheds.
WSPT is one of three King County(-ish) sewersheds in this dataset. You can find overviews, individual sewershed results, and a breakdown of variants for the state wastewater surveillance program, along with other metrics like case counts and hospitalizations for Covid-19 and other respiratory illnesses, at https://doh.wa.gov/data-and-statistical-reports/diseases-and-chronic-conditions/communicable-disease-surveillance-data/respiratory-illness-data-dashboard#WasteWater. If you go to the page and click "learn more" in the statewide view tab, you can find out lots of details about how these data are calculated and how to interpret them. The dashboard gets updated every Wednesday (generally). New! the Department of Health is here on the fediweb, at @WADeptHealth

Mastodon 4.3 will automatically boost Famichiki #pooptoots Fediverse-wise
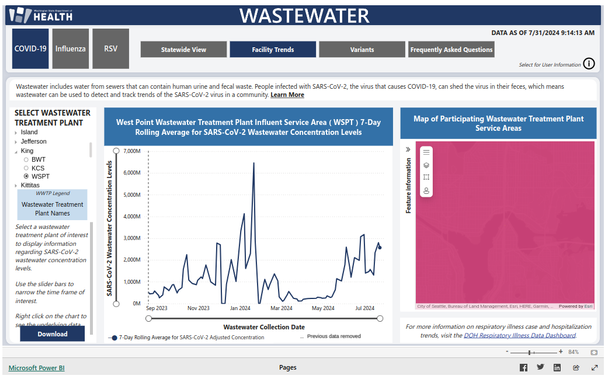
Hi, it’s the weekly #washingtonstate #kingcounty (that is, #seattle and environs) #COVID #COVID19 #wastewater #pooptoots.
The summer wave is still very much with us.:( Let's start with the West Point (WSPT) sewage treatment plant: the Sars-CoV-2 7-day rolling average is still high. The last 7DRA number was calculated on 7/23.
WSPT is one of three King County(-ish) sewersheds in this dataset. You can find overviews, individual sewershed results, and a breakdown of variants for the state wastewater surveillance program, along with other metrics like case counts and hospitalizations for Covid-19 and other respiratory illnesses, at https://doh.wa.gov/data-and-statistical-reports/diseases-and-chronic-conditions/communicable-disease-surveillance-data/respiratory-illness-data-dashboard#WasteWater. If you go to the page and click "learn more" in the statewide view tab, you can find out lots of details about how these data are calculated and how to interpret them. The dashboard gets updated every Wednesday (generally).
Note: when the state switched over to new data providers in September, they also removed the previous historical data from the graphical interface. That's because the two providers used different methodologies that made direct comparisons difficult. Unfortunately, it also removed valuable context for interpreting the results. So, keep in mind we're just seeing what happened in September 2023 until now.

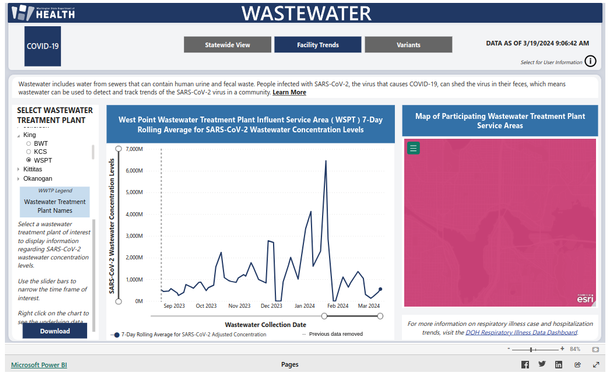
Hi, it’s the weekly #washingtonstate #kingcounty (that is, #seattle and environs) #COVID #COVID19 #wastewater #pooptoots.
Starting with the West Point (WSPT) sewage treatment plant: the Sars-CoV-2 7-day rolling average are up since last week's amazingly low numbers, and is now in line with what we saw at the beginning of fall last year. The last 7DRA number was calculated on 3/12.
WSPT is one of three King County(-ish) sewersheds in this dataset. You can find overviews, individual sewershed results, and a breakdown of variants for the state wastewater surveillance program, along with other metrics like case counts and hospitalizations for Covid-19 and other respiratory illnesses, at https://doh.wa.gov/data-and-statistical-reports/diseases-and-chronic-conditions/communicable-disease-surveillance-data/respiratory-illness-data-dashboard#WasteWater. If you go to the page and click "learn more" in the statewide view tab, you can find out lots of details about how these data are calculated and how to interpret them. The dashboard gets updated every Wednesday (generally).
Note: when the state switched over to new data providers in September, they also removed the previous historical data from the graphical interface. That's because the two providers used different methodologies that made direct comparisons difficult. Unfortunately, it also removed valuable context for interpreting the results. So, keep in mind we're just seeing what happened in September 2023 until now.
Hi, it’s the weekly #washingtonstate #kingcounty (that is, #seattle and environs) #COVID #COVID19 #wastewater #pooptoots.
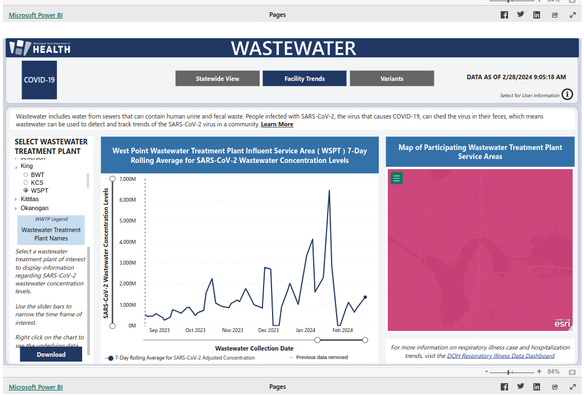
The West Point (WSPT) sewage treatment plant's detected Sars-CoV-2 7-day rolling average has started climbing again, ugh. The last 7DRA number was calculated on 2/20. Note: The end of January samples were missing, which somehow got translated as 0 values. That's why this graph looks so off.
WSPT is one of three King County(-ish) sewersheds in this dataset. You can find overviews, individual sewershed results, and a breakdown of variants for the state wastewater surveillance program, along with other metrics like case counts and hospitalizations for Covid-19 and other respiratory illnesses, at https://doh.wa.gov/data-and-statistical-reports/diseases-and-chronic-conditions/communicable-disease-surveillance-data/respiratory-illness-data-dashboard#WasteWater. If you go to the page and click "learn more" in the statewide view tab, you can find out lots of details about how these data are calculated and how to interpret them. The dashboard gets updated every Wednesday (generally).
Note: when the state switched over to new data providers in September, they also removed the previous historical data from the graphical interface. That's because the two providers used different methodologies that made direct comparisons difficult. Unfortunately, it also removed valuable context for interpreting the results. So, keep in mind we're just seeing what happened in September 2023 until now.
Hi, it’s the weekly #washingtonstate #kingcounty (that is, #seattle and environs) #COVID #COVID19 #wastewater #pooptoots.
Things are mostly looking greatly improved. I say “mostly” because we’re missing data for one of the three sewersheds, the West Point (WSPT) sewage treatment plant. At least that’s how I interpret the two 0.0 data points in the dataset for 1/28 and 1/30.
You can find overviews, individual sewershed results, and a breakdown of variants for the state wastewater surveillance program, along with other metrics like case counts and hospitalizations for Covid-19 and other respiratory illnesses, at https://doh.wa.gov/data-and-statistical-reports/diseases-and-chronic-conditions/communicable-disease-surveillance-data/respiratory-illness-data-dashboard#WasteWater. If you go to the page and click "learn more" in the statewide view tab, you can find out lots of details about how these data are calculated and how to interpret them. The dashboard gets updated every Wednesday (generally).
Note: when the state switched over to new data providers in September, they also removed the previous historical data from the graphical interface. That's because the two providers used different methodologies that made direct comparisons difficult. Unfortunately, it also removed valuable context for interpreting the results. So, keep in mind we're just seeing what happened in September 2023 until now.
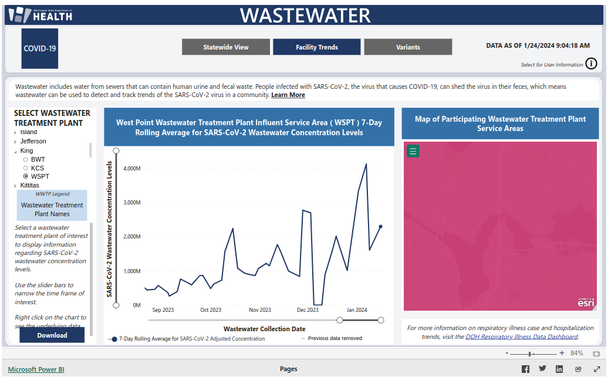
Hi, it’s the weekly #washingtonstate #kingcounty (that is, #seattle and environs) #COVID #COVID19 #wastewater #pooptoots.
Things are ... well, it's a mixed bag. The West Point (WSPT) sewage treatment plant Sars-CoV-2 7-day rolling average has climbed up a bit after last week's steep decline. It's not the highest we've seen since fall, but it's pretty high. The last 7DRA number was calculated on 1/16.
WSPT is one of three King County(-ish) sewersheds in this dataset. You can find overviews, individual sewershed results, and a breakdown of variants for the state wastewater surveillance program, along with other metrics like case counts and hospitalizations for Covid-19 and other respiratory illnesses, at https://doh.wa.gov/data-and-statistical-reports/diseases-and-chronic-conditions/communicable-disease-surveillance-data/respiratory-illness-data-dashboard#WasteWater. If you go to the page and click "learn more" in the statewide view tab, you can find out lots of details about how these data are calculated and how to interpret them. The dashboard gets updated every Wednesday (generally).
Note: when the state switched over to new data providers in September, they also removed the previous historical data from the graphical interface. That's because the two providers used different methodologies that made direct comparisons difficult. Unfortunately, it also removed valuable context for interpreting the results. So, keep in mind we're just seeing what happened in September 2023 until now.