
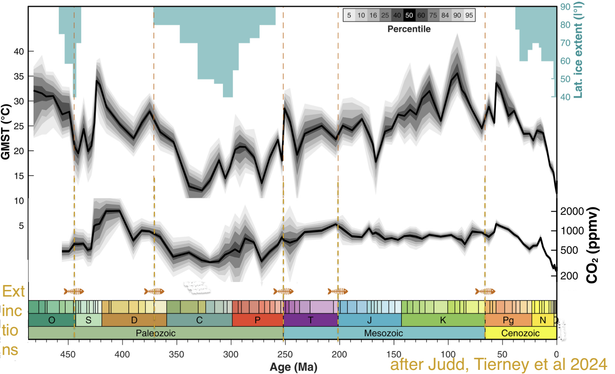
A new paper by #Judd and #Tierney et al maps temperature and CO2 for the last 485 million years. https://www.science.org/doi/10.1126/science.adk3705
Not the first attempt, other teams came before, and others will come after.
This one raises the global temperature bar to 35°C, and averages around 28 or so.
Their CO2 is almost always about 1000ppm and notably doesn't really follow the temperature evolution.
#GavinSchmidt blogged about the new paper: https://www.realclimate.org/index.php/archives/2024/09/phantastic-job/
I needed to see their charts in context with the Earth's land-ocean-mountain configuration so I put it all together in a movie, with one of Chris Scotese's tectonics animations. https://www.youtube.com/watch?v=bzvOMee9D1o&t=22s
The two globes are western and eastern hemisphere.
Also, because it was global #ClimateStrike today, the music I added is what #IgorLevit played a day after the big #climate protest in 2019, to honour the millions of people on the streets. "We the people will never be defeated".
#paleoclimate #PlateTectonic #CO2 #Klimastreik #FridaysForFuture
