Jeff Smith's Math Puzzle for May 15, 2026 – Swimming from Crab Cove to Ballena Bay under three hours—a new record. https://alamedapost.com/features/puzzles/math-puzzle-may-15-2026/
This is my Bongard problem n. 48, something simpler to relax. Try to write your solution (with a spoiler if you want). I'll give my solution tomorrow.
For more info about Bongard problems in general take a look at my first messages:
https://mathstodon.xyz/@leonardom/116110015131667314
https://mathstodon.xyz/@leonardom/116110093951382315
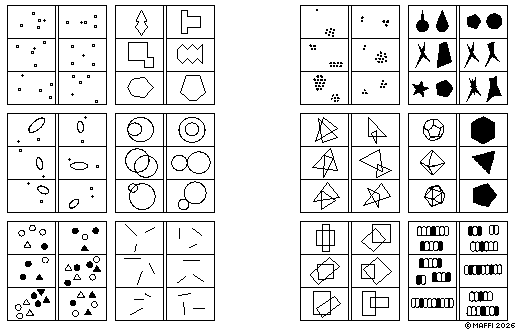
I think this was one of my best (meta) Bongard problems :-) 🥳
Sub-BP solutions (rules just about the left sides):
1: deleting the circlet closer to the cross, you get the vertices of an equilateral triangle;
2: the vertices of the polygon lay on the line of their axis of symmetry;
3: the cross is on the line of the major axis of the ellipse;
4: at least one circle lays on the center of another circle;
5: the black objects are linearly separable from the empty (stroked) ones;
6: the 3 segments lay on lines that intersect (approximately) in one point;
- - - -
7: the biggest number of points is divisible by the other number;
8: the right figure is the convex hull of the figure on the right;
9: every triangle vertex is outside the other triangle or lays on a side of the other;
10: platonic solids;
11: the two rectangles intersect in 4 points;
12: there are three groups of white pills (ellipses), that are separated by black pills (or by background space).
So the solution to my meta-Bongard problem 47 is: to solve the sub-Bongard problems on the left you need to add one or more imaginary points, segments or lines. While for the problems on the right you can find points, but (I think) you don't need to add primitives.
In mathematics you can find examples of both kinds of problems :-)
See also about auxiliary constructs:
https://en.wikipedia.org/wiki/Auxiliary_line
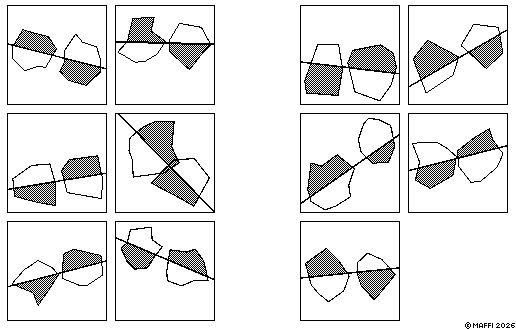
This is my Bongard problem n. 47, and it's a meta Bongard problem like the precedent one (https://mathstodon.xyz/@leonardom/116560916881319250 ). I think you need a bit of thinking to solve this problem (and it required me some time to create it), have fun. Try to write your solution (with a spoiler if you want). I'll give my solution tomorrow.
For more info about Bongard problems in general take a look at my first messages:
https://mathstodon.xyz/@leonardom/116110015131667314
https://mathstodon.xyz/@leonardom/116110093951382315
The solutions of the sub-problems (left side / right side):
1: two triangular objects / one rectangular object;
2: some odd prime numbers / some even numbers;
3: big stroked objects / small filled objects;
4: horizontal convex objects / vertical concave objects;
5: open curved lines / closed polygonal chains;
6: polygons with tree dots each inside / ellipses with two dots each inside;
- - - -
7: aligned crosses / unaligned crosses;
8: stroked objects / filled objects;
9: horizontal ellipses / vertical ellipses;
10: cyclic graphs / acyclic graphs;
11: even integers / odd integers;
12: platonic solids / regular polygons.
So for example in the sub-problem of box 1 a solution could be "triangles on the right, rectangles on the left" or "two objects on the left, one object on the right".
So the solution to my meta-Bongard problem 46 is: sub-problems with two solutions in the left boxes, with just one solution in the right boxes.
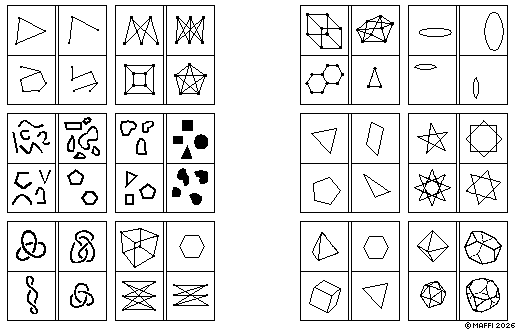
This is my Bongard problem n. 46, and it's a meta Bongard problem like the precedent one (https://mathstodon.xyz/@leonardom/116560916881319250 ). I think this is less easy. Try to write your solution (with a spoiler if you want). I'll give my solution tomorrow.
For more info about Bongard problems in general take a look at my first messages:
https://mathstodon.xyz/@leonardom/116110015131667314
https://mathstodon.xyz/@leonardom/116110093951382315
The solutions of the sub-problems (left side / right side):
1: cyclic graphs / acyclic graphs;
2: planar graphs / not planar graphs;
3: open lines / closed lines;
4: stroked figures / filled figures;
5: unknots / knots;
6: cubic graphs / not cubic graphs;
- - - -
7: unit distance graphs / other graphs;
8: Ellipses with horizontal major axis / vertical;
9: regular stroked polygons / irregular ones;
10: star polygons / polygonal compounds;
11: platonic solids / regular polygons;
12: platonic solids / Archimedean solids (Truncated tetrahedron, Truncated cube).
So the solution to my meta-Bongard problem 45 is: topological Bongard problems vs geometrical Bongard problems.
This is a fairly well known problem but fun if you've never thought about it before:
How many times would you expect to toss a fair coin before getting three heads in a row?
This is my Bongard problem n. 45, and it's a meta Bongard problem: each of the 12 boxes is divided in 2 mini-boxes on the left and 2 mini-boxes on the right, and you need to solve these two sets of mini-boxes like a sub-problem first, distinct from all the other 11 sub-problems. The solution of the global Bongard problem is the rule that tells apart what's different between the sub-problems of the left and the sub-problems on the right. Try to write your solution (with a spoiler if you want). I'll give my solution tomorrow.
For more info about Bongard problems in general take a look at my first messages:
https://mathstodon.xyz/@leonardom/116110015131667314
https://mathstodon.xyz/@leonardom/116110093951382315
Solution to my BP 44: Combinatorics on the left, versus Geometry on the right.
Detailed boxes contents:
1: Number the urns from 1 to u. Line up the indistinguishable balls in a row. Split this row up into u sections by inserting u-1 separators. All balls to the left of the j-th separator and to the right of the (j-1)-st separator (counting from, say, the left end) go into the j-th urn. You now have a row of b+u-1 objects of which b are balls and u-1 are separators. There are C(b+u-1,b) ways to choose the locations for the b balls among the b+u-1 objects. This example: 4 balls (o), 3 urns, 2 separators (|). C(6,4) = C(6,2) = 15 ways;
2: permutations of 4 objects, alternative visualization (as string diagrams);
3: Petersen graph;
4: Cayley table of the symmetric group S_3 (drawn as string diagrams), that is all the compositions of the permutations of 3 items;
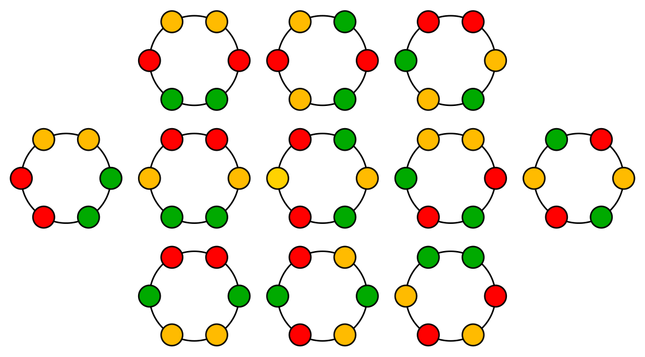
5: the 11 bracelets with 2 white, 2 black and 2 grey beads. Five are chiral, so there are 16 necklaces in total. See:
https://en.wikipedia.org/wiki/Necklace_(combinatorics)
6: Young diagrams associated to the (unlabeled) partitions of the positive integer 8. See:
https://en.wikipedia.org/wiki/Integer_partition
https://oeis.org/A000041
- - - -
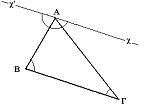
7: an euclidean construction from Euclid 'Elements':
https://schoolworkhelper.net/euclidean-geometry-math-history/
8: Diagram of a truncated cone, with its radius and height;
9: a shaded tetrakis hexahedron (a Catalan solid);
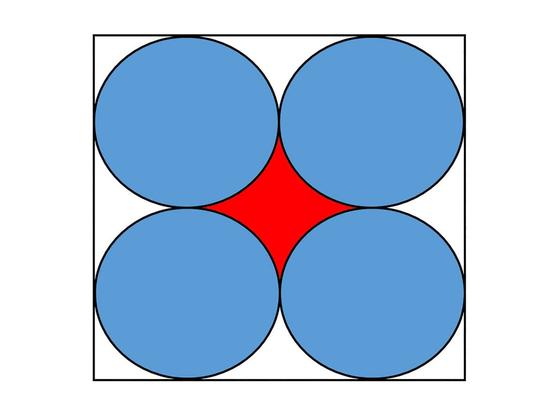
10: origami crease pattern based on the Circle packing technique. See:
https://abrashiorigami.com/crease-pattern/
11: Koch snowflake, iteration 4;
12: a little square drawn with the turtle geometry (see my Bongard problem n. 36).