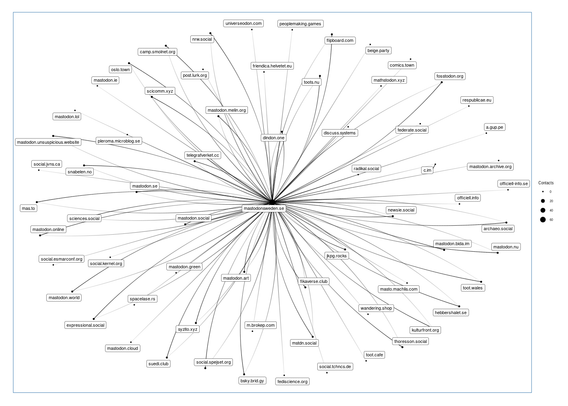
Mitt Fediverse. Graf över vilka servrar på i Fediverse jag interagerar med. Jag följer konton på (mörk grå linje) och jag har följare på (ljus grå linje). Postad med #rtoot #ggplot2 #ggraph #rstats
#TidyTuesday A look at @drob 's #R scripts' most common functions. As expected, #tidyverse and #ggplot2 dominate!
Data: {funspotr} by @brshallo
Code🔗https://tinyurl.com/tidy-drob
Tools: #rstats, #ggraph, #ggtext, #packcircles
Presentations, Projects & Data Viz - Tidy Tuesday David Robinson’s functions

#TidyTuesday #ShinyConf2024 Linkages (imports) between packages of the Top 20 (by number of packages) R packages' maintaining authors.
Code🔗https://tinyurl.com/r-pkg-auth
Data: @ShinyConf, @jonthegeek, @tracykteal
Tools: #rstats, #ggplot2, #tidygraph & #ggraph by @thomasp85; #PNWColors
Presentations, Data Viz & More - Data Visualization Projects

For those who love visualizing spatial networks: a new #ggraph is released with #sfnetworks compatibility! https://www.data-imaginist.com/posts/2024-02-15-ggraph-2-2-0/ #rstats #rspatial #dataviz Work done by @thomasp85 and @loreabad6
Data Imaginist - A bunch of giraffes, all bundled up

ggraph 2.2.0 has been released. This was definitely not supposed to be a feature release, yet here we are…

Data Imaginist

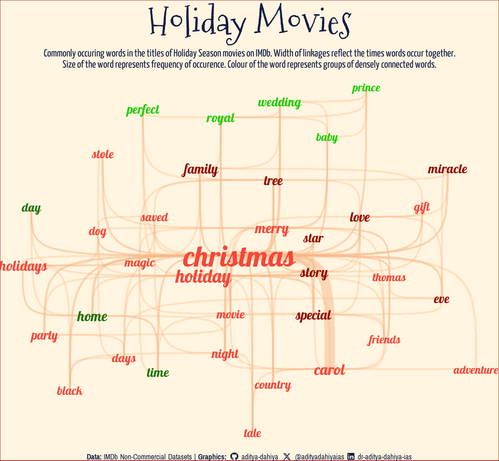
#TidyTuesday Linkages of most common words in holiday season movies' titles on #IMDb data. The words "Christmas", "Holiday" and "Carol" are strongly linked. While, "perfect", "royal" and "wedding" occur together.

Code🔗http://tinyurl.com/tidy-holidays

Created using #tidygraph and #ggraph by @thomasp85

#dataviz #rstats #movies @R4DSCommunity

projects_presentations/projects/holiday_movies_tidy.R at main · Aditya-Dahiya/projects_presentations

Presentations, Data Viz & More. Contribute to Aditya-Dahiya/projects_presentations development by creating an account on GitHub.

GitHub

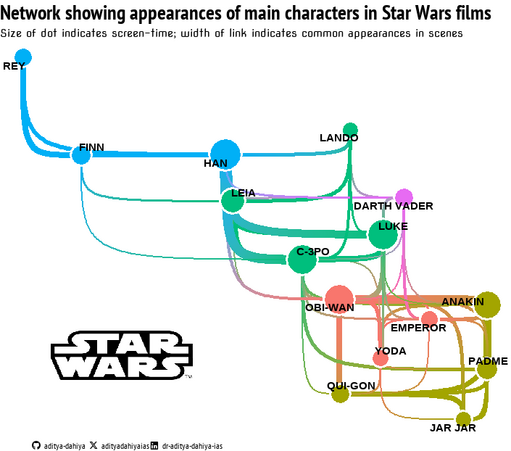
Star Wars characters' Network graph with #ggplot2 using #tidygraph and #ggraph packages by @thomasp85

Inspiration: Chapter 7 of the Book ggplot2 (3e) by @hadleywickham @thomasp85 and @djnavarro

Code & Examples🔗: https://aditya-dahiya.github.io/ggplot2book3e/Chapter7.html
#dataviz #rstats #storytellingwithyou

Solutions (and Beyond): ggplot2 - Chapter 7

Networks

#RStatsFR - Nouveau tuto sur le blog: "Dessine moi un arbre…" par Murielle
💪 Utilisez #igraph et #ggraph pour vos arbres de décision ou généalogiques....
🔗 https://thinkr.fr/dessine-moi-un-arbre/
Dessine moi un arbre... - ThinkR - Certification & Formation langage R

Si vous cherchez à dessiner un arbre sur R, que ce soit un arbre de décision ou un arbre généalogique … vous trouverez ici une méthode simple pour le réaliser.

ThinkR - Certification & Formation langage R

#30DayChartChallenge | April 2023 - Day 17 | networks

network diagram of tv networks 📺

code: https://github.com/curatedmess/30DayChartChallenge/blob/main/2023/04172023/day_17.R

Caution, the code is a bit rough...I started with a project I abandoned a year ago.

#ggplot #rstats #dataviz #ggraph

30DayChartChallenge/day_17.R at main · curatedmess/30DayChartChallenge

Contribute to curatedmess/30DayChartChallenge development by creating an account on GitHub.

GitHub