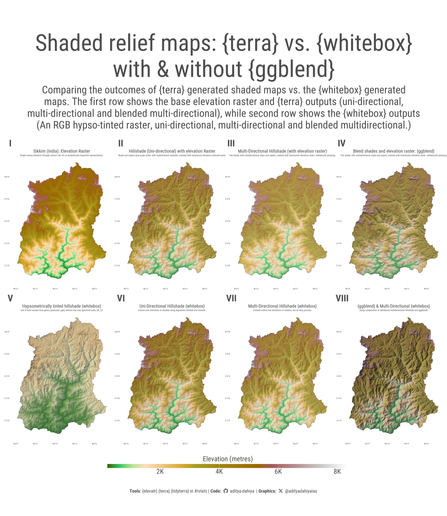
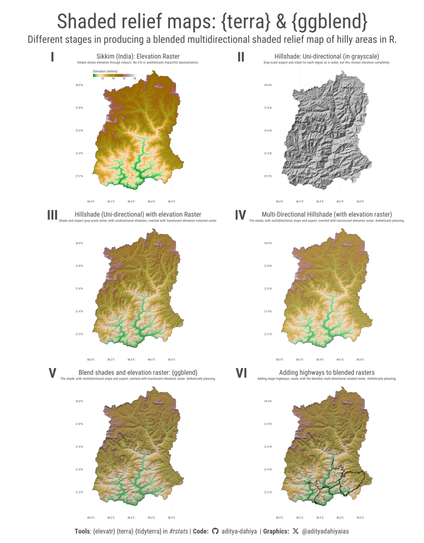
#dataviz #maps Comparing hill-shade maps in R using {terra} vs. {whitebox} - along with impressive effects of {ggblend}. Example code for Sikkim in #India.
Data: #elevatr by US EPA
Full Code🔗https://tinyurl.com/maps-shaded
Tools: #rstats, #ggplot2, #ggblend by @mjskay , #whitebox by Qiusheng Wu
Showing elevation in Maps (2) : {whitebox} & {terra} – visage

#dataviz #maps Code techniques to produce blended, shaded-relief maps with {terra}, {ggblend} and {tidyterra} in #rstats for state of Sikkim, India.
Data: {elevatr} by US EPA.
Full Code🔗https://tinyurl.com/terra-ggblend
Tools #ggplot2 #ggblend by @mjskay #terra
Showing elevation in Maps (2) : {whitebox} & {terra} – visage

Striking drop in annual growth of GDP per capita from 2019 to 2020 💸

A series of #dataviz|es as alternatives to two choropleth maps, comparing the trends per year as shared by Max Roser (OurWorldInData).

1⃣ Slope graph showing trends for 196 countries, overall and split per continent

🛠️ #rstats + #ggplot2, using the new #ggblend 📦

Also, #ggblend can do more than just blending! It is actually a tiny algebra of layer manipulations, including copying, adjusting aesthetics and params, and affine transformations

A simple example: to make a line more salient, we might put a thicker, white copy behind it

Here's an example of #ggblend with #ggdist: ggdist can create gradient lineribbons using color ramps, but can have problems when they overlap

ggblend can partition a geometry and blend those partitions: e.g. using "multiply" to blend overlapping lineribbons together

The #ggblend #rstats package is now on CRAN!! https://mjskay.github.io/ggblend/

ggblend is a small algebra of operations for blending, copying, adjusting, and compositing layers in ggplot2

One problem it solves is making plots independent of draw order: e.g. by using commutative blends, like "lighten" or "multiply"

Blending and Compositing Algebra for ggplot2

Algebra of operations for blending, copying, adjusting, and compositing layers in ggplot2. Supports copying and adjusting the aesthetics or parameters of an existing layer, partitioning a layer into multiple pieces for re-composition, applying affine transformations to layers, and combining layers (or partitions of layers) using blend modes (including commutative blend modes, like multiply and darken). Blend mode support is particularly useful for creating plots with overlapping groups where the layer drawing order does not change the output; see Kindlmann and Scheidegger (2014) <doi:10.1109/TVCG.2014.2346325>.