Woohooo ! 46 ⭐ for the #ncmaps repo on github.
Is it fame yet 😅 ?
" ncmaps brings scientific colormaps to ncview. "

Woohooo ! 46 ⭐ for the #ncmaps repo on github.
Is it fame yet 😅 ?
" ncmaps brings scientific colormaps to ncview. "
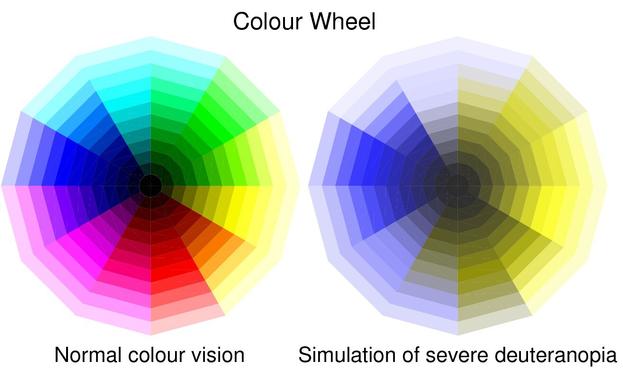
When you’re thinking about colour scales for your next figure, please remember to consider accessibility issues and avoid rainbow colour schemes.
Also avoid colour scales with just reds and greens to ensure those with deutranaopia colour blindness can read it accurately.
About 8% of men, and 0.5% of women have some form of colour blindness.
https://www.climate-lab-book.ac.uk/2015/reinventing-colour-wheel/
Our new paper a) shows that many papers (still) use a #rainbow color map for visualizations and b) give guidance to do better! #endrainbow @[email protected] @[email protected] @[email protected] @[email protected] #OpenAccess https://hess.copernicus.org/articles/25/4549/2021/
🐦🔗: https://twitter.com/michistoelzle/status/1430141197054627844


<p><strong class="journal-contentHeaderColor">Abstract.</strong> Nowadays color in scientific visualizations is standard and extensively used to group, highlight or delineate different parts of data in visualizations. The rainbow color map (also known as jet color map) is famous for its appealing use of the full visual spectrum with impressive changes in chroma and luminance. Besides attracting attention, science has for decades criticized the rainbow color map for its non-linear and erratic change of hue and luminance along the data variation. The missed uniformity causes a misrepresentation of data values and flaws in science communication. The rainbow color map is scientifically incorrect and hardly decodable for a considerable number of people due to color vision deficiency (CVD) or other vision impairments. Here we aim to raise awareness of how widely used the rainbow color map still is in hydrology. To this end, we perform a paper survey scanning for color issues in around 1000 scientific publications in three different journals including papers published between 2005 and 2020. In this survey, depending on the journal, 16 %–24 % of the publications have a rainbow color map and around the same ratio of papers (18 %–29 %) uses red–green elements often in a way that color is the only possibility to decode the visualized groups of data. Given these shares, there is a 99.6 % chance to pick at least one visual problematic publication in 10 randomly chosen papers from our survey. To overcome the use of the rainbow color maps in science, we propose some tools and techniques focusing on improvement of typical visualization types in hydrological science. We give guidance on how to avoid, improve and trust color in a proper and scientific way. Finally, we outline an approach how the rainbow color map flaws should be communicated across different status groups in science.</p>
📣 Shoutout 📣 to @[email protected] for the Scientific colour maps project, which we used in our plots to ensure they are accessible and easily distinguishable.
http://fabiocrameri.ch/colourmaps
#useBatlow #endRainbow
#ScientificVisualisation #colors
#OpenSource #Accessibility
