Grafana's #Pyroscope 2.0 Makes #ContinuousProfiling Practical at #Scale

Set up continuous profiling for Java 24 services using Pyroscope 1.0 and OpenTelemetry 1.20. Lower overhead, faster diagnostics, reduced observability costs. Step-by-step guide covers instrumentation, pipeline setup, and visualization. #continuousprofiling #opentelemetry

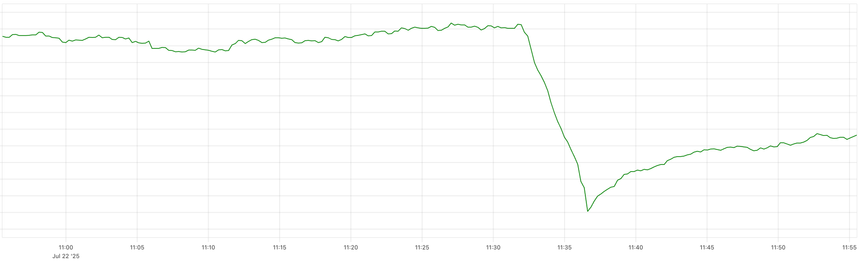
Yeah, trust me, you want #continuousprofiling. We would have never just noticed this improvement in a latency-critical component in Polar Signals Cloud if we didn't have continuous profiling. 50% CPU improvement with a ~5-line code change.
I often hear people say "we're not at that level of optimizing". I've not found one company this was true for, and you're missing out on opportunities like these.
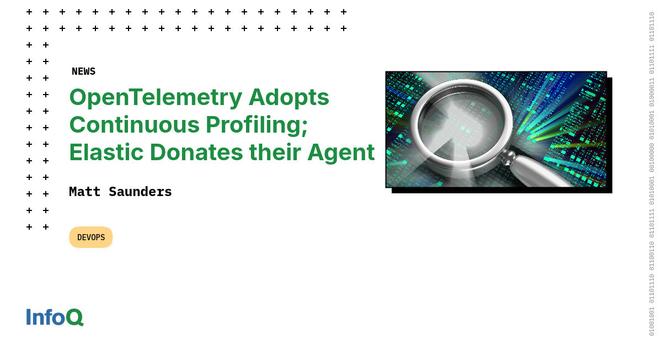
#OpenTelemetry has announced that it has incorporated #ContinuousProfiling as a core telemetry signal, and #Elastic has donated its continuous profiling agent to the OpenTelemetry project.
Dive deeper: https://bit.ly/4coAoF2

Great addition to #OpenTelemetry: Elastic Contributes its #ContinuousProfiling Agent to OpenTelemetry. Way to go 👏
Check out the announcement for details: https://opentelemetry.io/blog/2024/elastic-contributes-continuous-profiling-agent/
To learn more about how OpenTelemetry embraces profiling as its fourth observability signal, what's a full-host profiler, and what it means for users, check out my episode of OpenObservability Talks I had with Felix Geisendörfer and Ryan Perry of the OTel profiles SIG:
https://logz.io/blog/opentelemetry-embraces-profiling/?utm_source=devrel&utm_medium=devrel

Elastic Contributes its Continuous Profiling Agent to OpenTelemetry
Following significant collaboration between Elastic and OpenTelemetry’s profiling community, which included a thorough review process, we’re excited to announce that the OpenTelemetry project has accepted Elastic’s donation of its continuous profiling agent. This marks a significant milestone in establishing profiling as a core telemetry signal in OpenTelemetry. Elastic’s eBPF based profiling agent observes code across different programming languages and runtimes, third-party libraries, kernel operations, and system resources with low CPU and memory overhead in production. Both, SREs and developers can now benefit from these capabilities: quickly identifying performance bottlenecks, maximizing resource utilization, reducing carbon footprint, and optimizing cloud spend.
Understanding continuous profiling: part 2. #PHP #ContinuousProfiling
https://www.blackfire.io/?utm_source=flipboard&utm_medium=activitypub
Posted into SYMFONY FOR THE DEVIL @symfony-for-the-devil-mobileatom
Crush performance bottlenecks | Blackfire PHP & Python Observability
Blackfire's continuous observability solution empowers developers to monitor their applications' real-time behavior and proactively identify existing bottlenecks or the consequences of upcoming changes before they reach production.
W00t my OpenObservability Talks episode on Continuous Profiling and #OpenTelemetry with the members of the Special Interest Group on Profiles is featured on the Observability Newsletter
https://o11y.news/2024-03-11/
Soon also on the podcast apps 🎧
#opensource #observability #cloudnative #profiling #continuousprofiling #performance
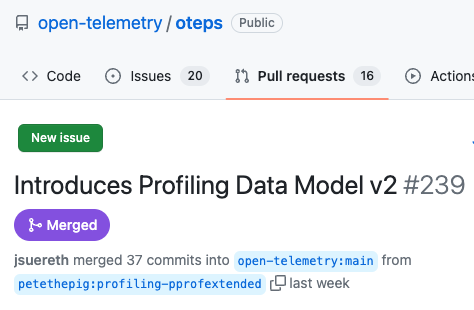
A major milestone for adding Continuous Profiling to #OpenTelemetry:
The extension proposal (OTEP) outlining the data model has been merged 🎉
I need to look into that deeper with the SIG members behind it - watch out for an OpenObservability Talks special 😉
#opensource #observability #continuousprofiling #profiling #devops
The extension proposal (OTEP) outlining the data model has been merged 🎉
I need to look into that deeper with the SIG members behind it - watch out for an OpenObservability Talks special 😉
#opensource #observability #continuousprofiling #profiling #devops
📢 Announcing #arm64 support in @parca Agent! Get ready to support your move to arm64 and be confident in its performance!
Learn on the blog how we made it happen!
#observability #profiling #dwarf #continuousprofiling
https://www.polarsignals.com/blog/posts/2023/10/17/profiling-arm64-with-ebpf-in-parca-agent

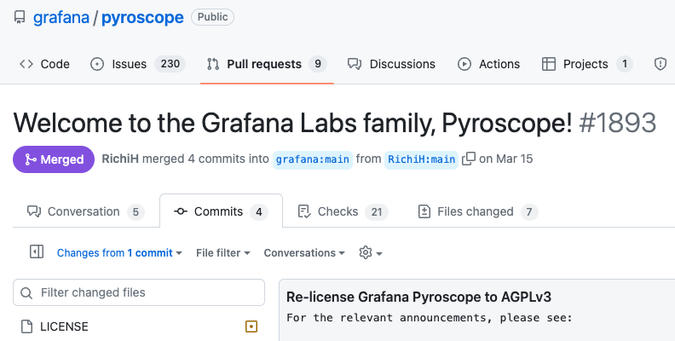
Title: "Welcome to the Grafana Labs family, Pyroscope!"
Details: "Re-license Grafana Pyroscope to AGPLv3"
another Apache2 #foss going #copyleft
As I say: Is vendor owned #opensource an oxymoron?
https://horovits.medium.com/is-vendor-owned-open-source-an-oxymoron-b5486a4de1c6