Just discovered this very nice piece of software. Very plug and play, nice and easy to use. If you work with #OpenTelemetry, I would definitely recommend
https://github.com/mesaglio/otel-front
https://github.com/mesaglio/otel-front

Example of creating Recording Rules for metrics and alerts from OpenTelemetry traces in VictoriaTraces - latency and errors in a Backend API, AWS ALB, and PostgreSQL
Agents will make your telemetry explode. You are not ready
에이전트 기반 자동화가 급증하면서 기존의 텔레메트리 및 관측성 시스템이 감당하지 못하는 데이터 폭증과 복잡한 상태 조합 문제가 발생하고 있다. 기존의 메트릭, 로그, 트레이스 분리 방식은 에이전트 속도에 맞춰 확장되지 못하며, 컨텍스트 손실로 인해 문제 원인 추적이 어려워진다. OpenTelemetry의 올바른 활용과 W3C 트레이스 컨텍스트 표준을 통한 신호 연계가 필수적이며, 에이전트의 의사결정 경로를 관측 가능하게 설계하는 것이 관건이다. AI 에이전트 시대에 맞는 관측성 아키텍처 재설계가 시급하다.
https://shippingbytes.com/2026/05/21/agents-will-make-your-telemetry-explod/
#observability #telemetry #aiagents #opentelemetry #monitoring
I have operated systems at scale long enough to know that the scariest failures are not the ones that blow up immediately. They are the ones that accumulate quietly, in the background, until the night you realize you cannot see what is happening anymore. Agents are going to do that to your observability stack. Vercel […]
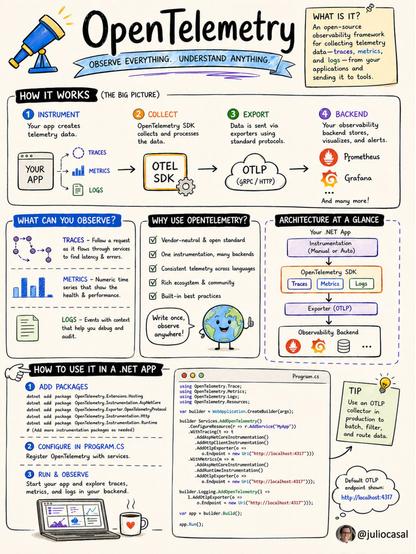
Something broke in prod. You have no idea where. That's not a bug. That's a missing observability layer. Many engineering teams reach for logs first. And logs help. But logs alone won't tell you why a request took 4 seconds, which service caused the cascade, or whether the problem is CPU, memory, or a slow database call. That's what OpenTelemetry solves. It's a vendor-neutral, open standard for collecting the three signals you actually need: 𝐓𝐫𝐚𝐜𝐞𝐬 tell you what happened to a request across every service it touched. You see exactly where latency was introduced and where errors occurred. 𝐌𝐞𝐭𝐫𝐢𝐜𝐬 give you the numbers over time. Request rates, error rates, GC pressure, thread pool saturation. The stuff that tells you when a system is about to break, not just after it does. 𝐋𝐨𝐠𝐬 still matter, but structured logs correlated with trace IDs are a completely different tool than raw text files. Here's what makes OpenTelemetry different from everything before it: → One SDK. Any backend. No vendor lock-in. → Works with Jaeger, Prometheus, Grafana, Aspire, Azure Monitor, Datadog, whatever you use. → Auto-instrumentation for ASP .NET Core, HttpClient, EF Core, and more. → The industry has aligned on this. It's not going away. In ASP .NET Core, setup is a few NuGet packages and a handful of lines in Program.cs. The image has the full code pattern. The real unlock is running an OTLP Collector in production. You batch, filter, and route telemetry without touching your app. Change your backend without a redeploy. Here's a full blueprint to start your next .NET project with all the OpenTelemetry goodness wired up 👇 https://lnkd.in/gnQhKDDC | 12 comments on LinkedIn
#OpenTelemetry is a #CNCF graduated project
From OpenCensus and OpenTracing to today, this project has been a community effort from the beginning.
Thank you to everyone who contributed code, docs, specs, reviews, feedback, support, and end-user experiences. This milestone belongs to you.

👇 Learn why #Spotify Engineering relied on #VictoriaMetrics for extreme #Scale observability in this case study.
https://bit.ly/49e5P6w
Spotify needed to replace its legacy in-house time series database to overcome stability and performance limitations, which would bring about query delays and timeouts. The Spotify observability team chose VictoriaMetrics to support efficient metric ingestion, querying, and alerting at scale.
PromptVC, version control for prompts in production
PromptVC는 프로덕션 환경에서 LLM 프롬프트 변경 이력을 체계적으로 관리하는 버전 관리 도구입니다. 프롬프트 변경에 따른 성능, 비용, 응답 품질 변화를 추적하고, 텍스트 차이뿐 아니라 행동 차이까지 비교해 운영상의 불확실성을 줄입니다. OpenTelemetry와 OpenInference를 활용해 자동으로 LLM 호출을 계측하며, Python과 TypeScript SDK를 지원해 다양한 환경에 쉽게 통합할 수 있습니다. 통계적 벤치마크 기능도 제공해 프롬프트 변경의 효과를 객관적으로 평가할 수 있습니다.
https://www.promptvc.io/blog/introducing-promptvc
#llm #promptengineering #observability #versioncontrol #opentelemetry
Have you heard of #OpenTelemetry Arrow, but wasn't sure what it was all about? This blog post by Geeking Out host @adrianamvillela demystifies Arrow: What is it? What problem does it solve? How does it work?
And don't forget to subscribe to our Substack!

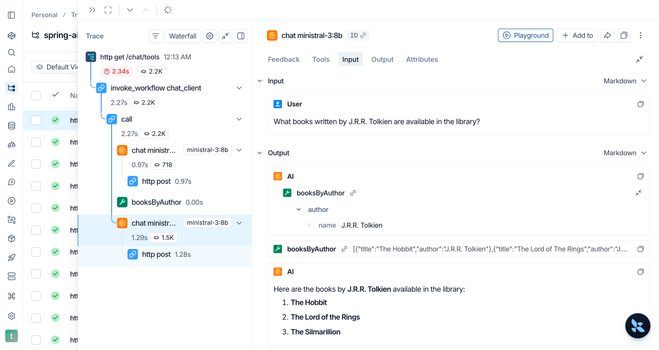
In this new article, I explain how to integrate your Spring AI application with LangSmith for observability, supported by OpenTelemetry and Arconia.
https://www.thomasvitale.com/spring-ai-observability-langsmith-arconia/