Most photographers look at a histogram and see a graph.
What you should see is a zone map.
https://substack.com/profile/23308165-marco-secchi/note/c-269929593
Most photographers look at a histogram and see a graph.
What you should see is a zone map.
https://substack.com/profile/23308165-marco-secchi/note/c-269929593
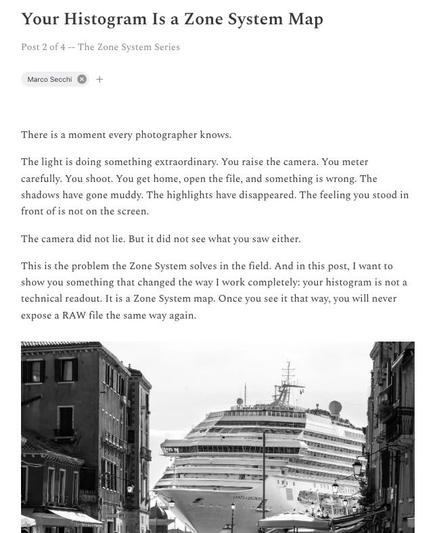
Most photographers look at a histogram and see a graph. What you should see is a zone map. Every part of that histogram -- left, center, right -- corresponds directly to Ansel Adams' 11 zones. Once you understand that, you stop guessing at exposure and start deciding. Post 2 of the Zone System series goes live tomorrow. It covers field metering, shadow placement, and three real exposure situations that come up constantly -- high contrast interiors, flat overcast light, and backlit subjects. Free readers get the first section. Subscribers get the full method. Seven-day free membership still open for the whole series. Link below.

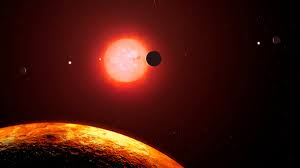
#KnowledgeBit: The '#Goldilocks #Zone,' or #Habitable zone, is the range of distance with the right temperatures for water to remain liquid.
Discoveries in the Goldilocks Zone, like Earth-size planet Kepler-186f, are what scientists hope will lead us to water and one day life.