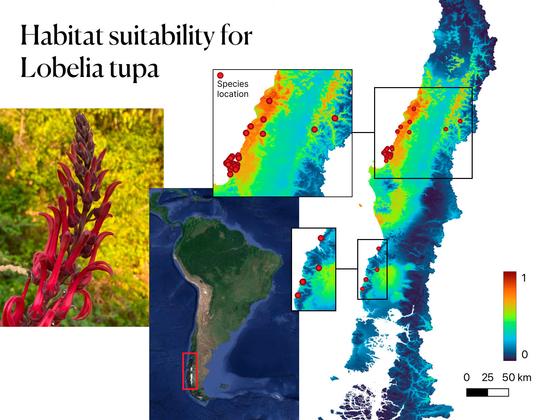
For #BiodiversityDay, we want to show you Lobelia’s work mapping suitable habitats based on hashtag#EO to identify biodiversity-rich areas and guide conservation efforts where they are most needed.
Check out the habitat suitability map for Lobelia tupa below.
By combining occurrence data from the GBIF: The Global Biodiversity Information Facility with bioclimatic information from #Worldclim, we model the probabilities of the species finding suitable conditions in different areas.