Latest paper by the ' #ResponseShift – in Sync Working Group' describes #QualitativeResearch examining RS and the synthesis calls for #triangulation of evidence to advance our understanding of RS
https://link.springer.com/article/10.1007/s11136-026-04290-0
Other publications by the group:
https://link.springer.com/search?facet-journal-id=11136&query=%22Response+Shift+%E2%80%93in+Sync+Working+Group%22&content-type=Article&dateFrom=&dateTo=&sortBy=relevance
Response shifting: a qualitative meta-synthesis on response shift - Quality of Life Research
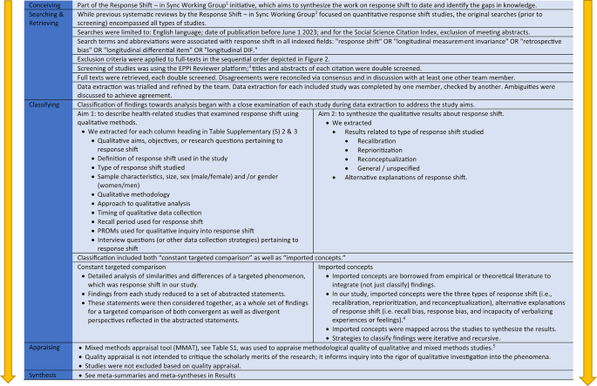
Purpose This qualitative meta-synthesis aimed to (1) describe health-related studies that examined response shift using qualitative methods, and (2) synthesize the qualitative results about response shift. Methods We systematically searched MEDLINE, PSYCINFO, CINAHL, EMBASE, Social Science Citation Index, and Dissertations and Theses Global to identify health-related studies using qualitative and mixed methods designs to examine response shift (n = 2221). Findings were classified using constant targeted comparison and “imported concepts” (e.g., recalibration). Results Of 1010 records screened, 33 had full-text screening; 14 were included, 10 of which used patient-reported outcome measures as part of their qualitative methods. Six studies specified a qualitative methodology. All of the 14 studies inferred evidence of response shift. Recalibration evidence was related to comparisons to previous health states or to others with poorer health; pre-existing expectations of current health; and adjustment of their quality of life standard. Reprioritization evidence was related to shifting life priorities to compensate for changing health status and forced changes in goals/priorities due to severity of treatment effects. Reconceptualization evidence was associated with changes in participants’ health conditions and/or treatment and commonly co-occurred with reprioritization highlighting their interconnectedness. Authors of 10 studies noted possible alternative explanations of response shift, including: recall bias, incapacity of verbalizing experiences/feelings, irrelevant stimuli, and response bias, none of which ruled out concurrent occurrence of response shift. Conclusion Future work is needed to engage in dialogue about how multiple lenses towards inquiry and analysis may be leveraged to examine the multiplicity of ways in which people experience change in meaning.

