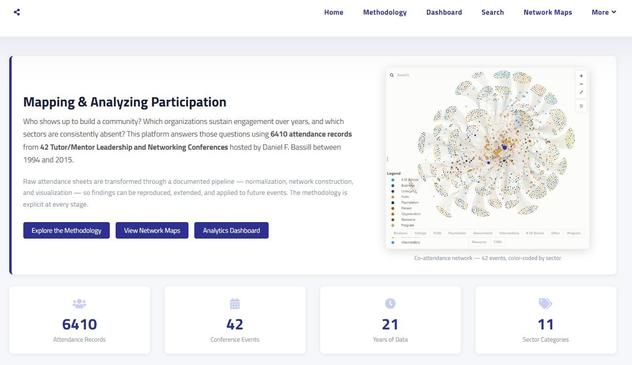
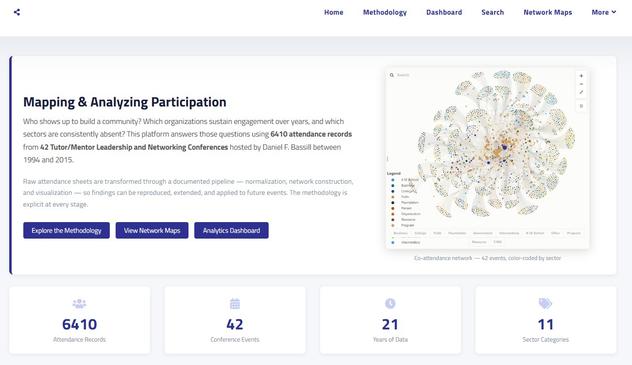
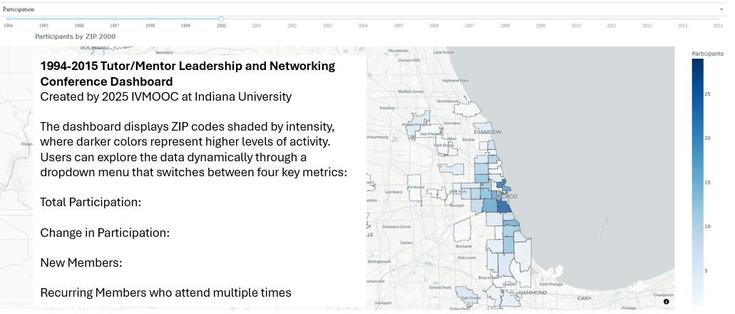
RE: https://bsky.app/profile/did:plc:eabbjcxbu7vlvybsmksh6i52/post/3mlr4rutds22i
This is the analytics dashboard created by the Spring 2026 #IVMOOC student team at Indiana University to analyze participation in 1993-2015 Tutor/Mentor Conferences that I hosted in Chicago.
View at https://tutormentor.blogspot.com/2026/05/mapping-analyzing-participation-spring.html
While these study the conferences they are intended to demonstrate how others can use the tool to analyze their own events.
Last night I pitched a project to the Spring 2026 #IVMOOC program at Indiana University. This extends a connection dating back to around 2008. See more at Spring 2026 https://michaelcnt.blogspot.com/2026/01/new-work-by-ivmooc-team-at-indiana.html
Most universities have some form of Information Visualization course. You could pitch a project idea like this to them.
This map showing 1994-2015 Tutor/Mentor Conference participation was created by a 2025 #IVMOOC team from Indiana University. Find the map link and analysis at https://mappingforjustice.blogspot.com/2026/01/mapping-conference-participation-ivmooc.html
This demonstrates the type of work students could be doing at any university.