Question for folks that use #leaflet or #htmlwidgets in #Rstats outside of RStudio/VSCode/Positron:

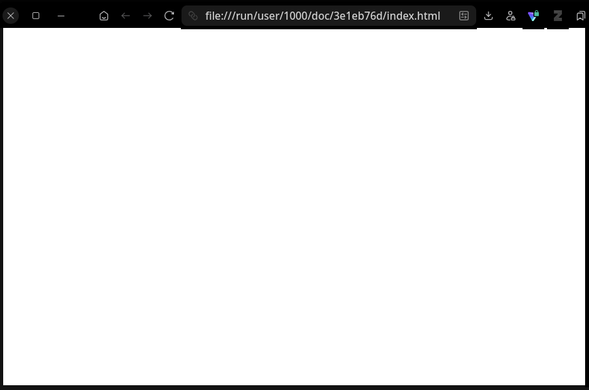
What does the default print method for leaflet() do when called from a regular R console? I'm just getting an apparently blank HTML file in my browser (see attached screenshot) when I print it in the console. If I render it in a Quarto HTML document it works great, but this is really annoying to have to re-render the document every time because I'm still learning leaflet and need to do a lot of quick trial and error.

I suspect the file isn't showing properly cause I'm calling it from inside a Toolbx OCI container but viewing it in the host browser. I can't easily test this right now though because my host R installation didn't survive the update from Fedora 42 -> 43, and rig hasn't added support for 43 yet.

@dom @manzt are #rstats #htmlwidgets getting left behind by #python #anywidget? This example and lonboard seems to say yes. Delighted to find https://github.com/keller-mark/anyhtmlwidget a couple of weeks ago.

For some context, see Trevor's youtube https://www.youtube.com/@trevmanz

GitHub - keller-mark/anyhtmlwidget: Bringing core concepts from anywidget to R

Bringing core concepts from anywidget to R. Contribute to keller-mark/anyhtmlwidget development by creating an account on GitHub.

GitHub
so excited to finally attend and present at #rinfinance in Chicago next week https://web.cvent.com/event/58ee0590-1071-42fd-a163-b827b1256991/websitePage:7ec01a22-d8ec-4eb2-ad21-446f9d024f11 and look forward to covering the combination of #rstats and finance with JavaScript through #htmlwidgets #shiny @gws #webr #shinylive

would love to know if anyone has any specific questions that I could address/explore in my presentation.
Agenda - 2024 R/Finance Conference

@hrbrmstr great to hear... I hope to continue the exploration with a series on 1) transforms and 2) labels. Seems like this will become my goto sparkline option when in JS.

Unfortunately the design of Observable Plot does not translate well to #rstats #htmlwidgets, but I hope I can find an elegant way of supporting.

https://github.com/timelyportfolio/oplot

GitHub - timelyportfolio/oplot: experimental R htmlwidgets wrapper for Observable Plot

experimental R htmlwidgets wrapper for Observable Plot - GitHub - timelyportfolio/oplot: experimental R htmlwidgets wrapper for Observable Plot

GitHub
Selfcontained Freedom on iPad (without Pandoc) - JavaScript in R

experimenting with how we can get #rstats #htmlwidgets in #webr... this post creates a reactable in webr and then builds the widget
https://www.jsinr.me/2023/12/11/htmlwidgets-webr-experiment/
htmlwidgets + webR - JavaScript in R

starting to think through @gws #rstats #webR with #htmlwidgets; also really liking playing with webR in stackblitz

https://github.com/r-wasm/webr/issues/248

Can webR open a new html window (e.g. using the "reactable" library")? · Issue #248 · r-wasm/webr

Hi. Your team continues to do really amazing work with WebR. Now appears to be a very usable IDE! I also saw that you've added a lot of packages which is very helpful. Specifically, I saw that you ...

GitHub

The {apexcharter} #rstats 📦 is an elegant R wrapper for the ApexCharts JavaScript library. It features ggplot-like syntax for creating Web charts with tooltips and download options. By Victor Perrier & Fanny Meyer
https://dreamrs.github.io/apexcharter/articles/apexcharter.html#bar-charts

Bar chart example:
apex(data = mpg, type = "column", mapping = aes(x = manufacturer, fill = year))

#dataviz @rstats #HTMLWidgets

Starting with ApexCharts

apexcharter