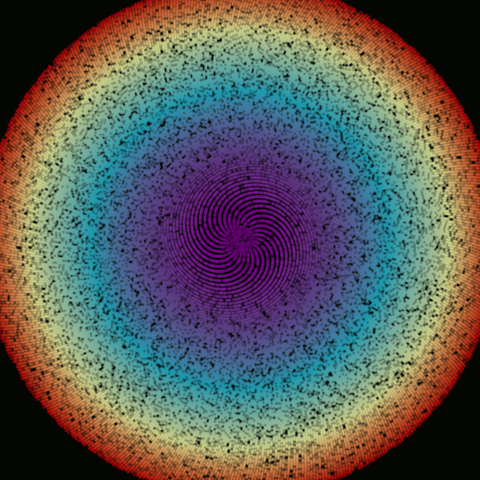
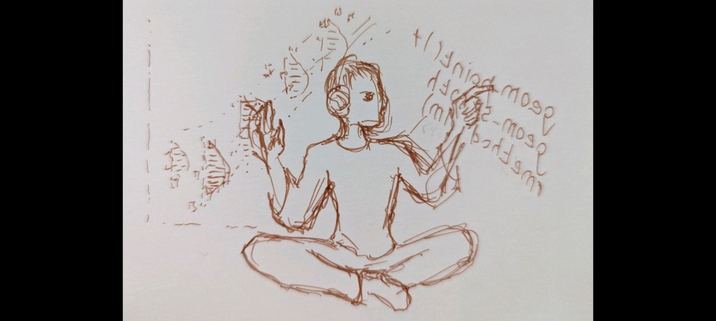
Es imposible renderizar emojis a color en #Matplotlib 🤔
En #Rstats puedes expresar las emociones con emojis
Thomas Lin Pedersen ragg #ggplot2 #tidyverse
#psicologia #UCR #python @nobodyinperson
Es imposible renderizar emojis a color en #Matplotlib 🤔
En #Rstats puedes expresar las emociones con emojis
Thomas Lin Pedersen ragg #ggplot2 #tidyverse
#psicologia #UCR #python @nobodyinperson
If you love 'ggiraph' for turning your #ggplot2 plots into interactive charts, then I highly recommend checking out 'ninejs' for the #Python equivalent in Plotnine! 📊
It turns static Plotnine/matplotlib charts into interactives with one line.
Link to this excellent project from Joseph Barbier : https://y-sunflower.github.io/ninejs/
Recent @DSLC club meetings:
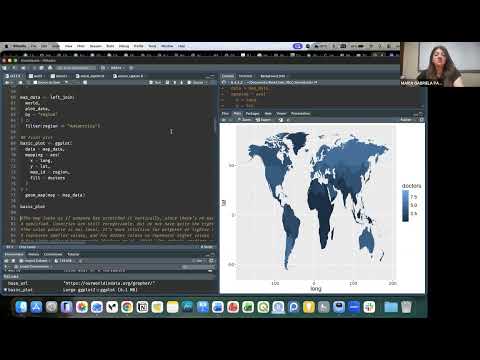
 The Art of Data Visualization with ggplot2: The TidyTuesday Cookbook: Doctors across the world: making maps with ggplot2 https://youtu.be/rBTQuK-yQg0 #RStats #DataViz #ggplot2 #TidyTuesday
From the @DSLC chives:
 Mastering Shiny: Layout, themes, HTML https://youtu.be/H7fjO6f-8xs #PyData #PyShiny #RShiny #RStats
Support the Data Science Learning Community at https://patreon.com/DSLC
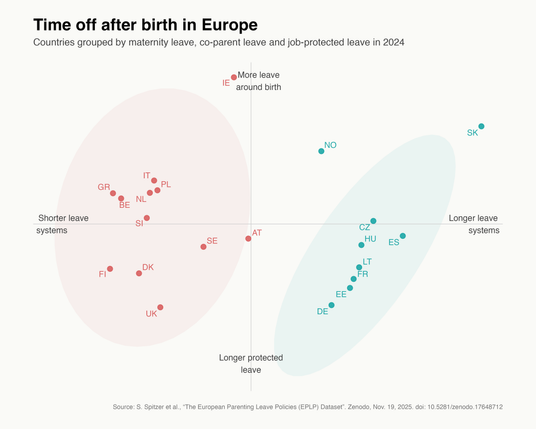
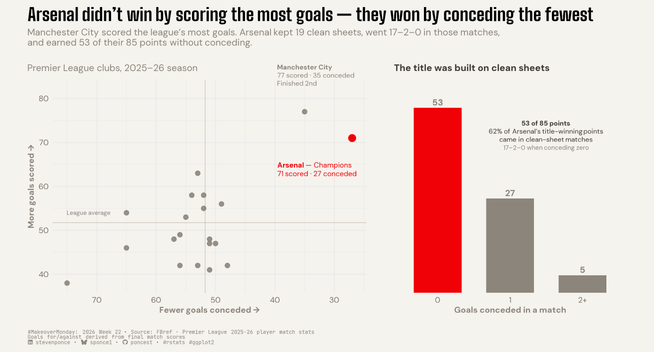
For week 22 of #TidyTuesday I explored European Parenting Leave Policies. I tried to cluster countries based on maternity leave, co-parent leave and job-protected leave durations.
Code: https://github.com/majaurankar/TidyTuesday/tree/main/2026/W22