
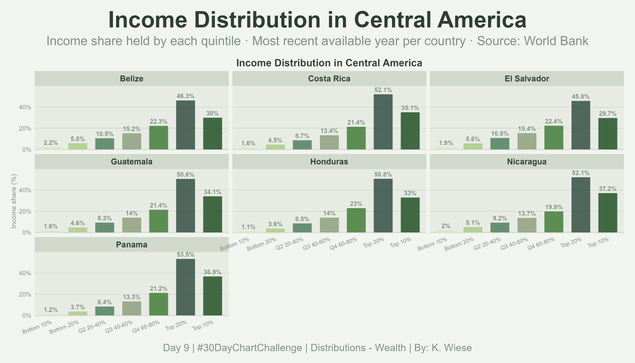
#Day9 | Distributions – Wealth | #30DayChartChallenge | Income Distribution in Central America, source World Bank. Built with #RStats using #ggplot2, #dplyr, #tidyr, #patchwork, #ggtext, #scales, #wbstats and #purrr.
📊 #30DayChartChallenge 2026 – day 08
.
Distributions | Circular
.
🔗 : https://stevenponce.netlify.app/data_visualizations/30DayChartChallenge/2026/30dcc_2026_08.html
.
#rstats | #r4ds | #dataviz | #ggplot2
.
Distributions | Circular
.
🔗 : https://stevenponce.netlify.app/data_visualizations/30DayChartChallenge/2026/30dcc_2026_08.html
.
#rstats | #r4ds | #dataviz | #ggplot2
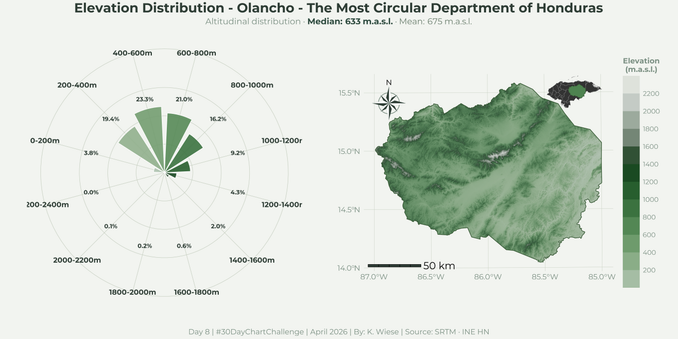
#Day8 | Distributions – Circular | #30DayChartChallenge | Elevation distribution in the most circular department of Honduras. Built with #RStats using #sf, #raster, #exactextractr, #ggplot2, #ggnewscale, #ggtext, #dplyr, #terra, #showtext, #scales, #patchwork and #ggspatial.
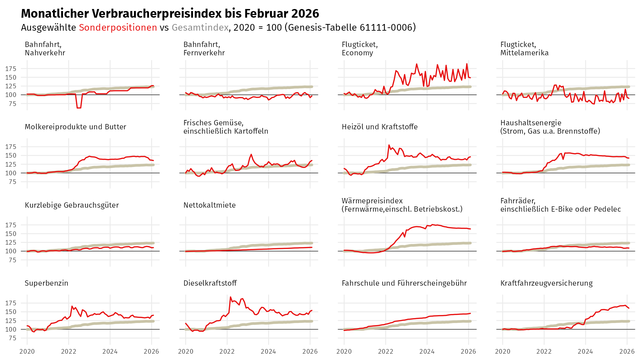
Mit #restatis und #ggplot2 habe ich ausgewählte Positionen der Preisstatistik visualisiert, die für #fedibikes und die #BahnBubble interessant sein können. Deutlich erkennbar etwa das 9€-Ticket. Am Freitag 10. April gibt es dann die Daten für März. Hier ist der R-Code zur automatischen monatlichen Aktualisierung bzw. um andere Inhalte auszuwählen (Bohnenkaffee, Instantkaffee, Kaffeekapseln, Kajalstift, Schokoladentafel …) https://github.com/wahlatlas/api/blob/main/inflation2026sonderpositionen.R oder direkt in der Tabelle https://www-genesis.destatis.de/datenbank/online/table/61111-0006
#Day7 | Distributions – Multiscale | #30DayChartChallenge | Comparison of NDVI distributions across two spatial scales. Built with #RStats using #ggplot2, #dplyr, #terra, #tidyterra, #patchwork, #ggtext, and #scales.
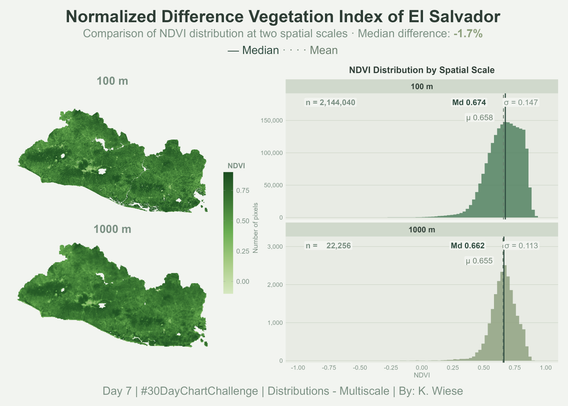
📊 #30DayChartChallenge 2026 – day 07
.
Distributions | Multiscale
.
🔗 : https://stevenponce.netlify.app/data_visualizations/30DayChartChallenge/2026/30dcc_2026_07.html
.
#rstats | #r4ds | #dataviz | #ggplot2
.
Distributions | Multiscale
.
🔗 : https://stevenponce.netlify.app/data_visualizations/30DayChartChallenge/2026/30dcc_2026_07.html
.
#rstats | #r4ds | #dataviz | #ggplot2

So excited that the brilliant @cynthiahqy will join the #ggplot2 extenders meetup to talk about the ideas in her blogpost 'Anatomy of a well designed plot helpers: An opinionated take on writing better ggplot2 helper functions with calendar plots as a design case' 📊🚨🚀 Looking forward to the discussion! studyhttps://www.cynthiahqy.com/posts/ggplot-helper-design/#anatomy-of-a-well-designed-plot-helper