I wanted metrics for my homelab. Grafana was a bit too complicated for me, so I tried Beszel. One click install on CasaOS + installed an agent with a simple script, and voila! Highly recommended
I wanted metrics for my homelab. Grafana was a bit too complicated for me, so I tried Beszel. One click install on CasaOS + installed an agent with a simple script, and voila! Highly recommended
Quand on a une petite infra, avec juste quelques machines à surveiller, #Beszel, c'est très très le bien ! Très simple à installer, et quasi rien en configuration.
Grâce à ça, j'ai pu voir des comportements pas normaux (bande passante qui pétait régulièrement les plafonds) sur le serveur d'un client et j'ai pu agir pour soulager le serveur¹ 🙂
Merci @benoit de me l'avoir fait découvrir 🙏
¹ merci `limit_rate` sur Nginx https://nginx.org/en/docs/http/ngx_http_core_module.html#limit_rate
⚡ Beszel: monitoring leggero per homelab. Un solo binario da 10 MB per monitorare server, container Docker e GPU — senza la complessità di Prometheus + Grafana. Installazione e configurazione allarmi in pochi passi.
https://gomoot.com/beszel-lalternativa-minimale-a-prometheus-grafana-per-il-monitoring-del-tuo-homelab/
@Codebender_Cate Take it one step at a time. For me it was starting with pictures. I installed Immich and moved my family off of Google/Apple for image sync. Then files was next for me, so I selected NextCloud. Then see what you have left going to big tech, rinse and repeat.
Also, I highly recommend an AI programming assistant like Claude Code or OpenAI Codex. It can greatly improve your IT abilities! In the last few months I have setup #Immich, #NextCloud, #Netbird, #UptimeKuma, #ForgeJo, #Authentik, #Pihole, #Beszel, #ActualBudget, #OpenWebUI, #Nfty, and #Tautulli.
Ok, that was kinda premature and stupid panic.
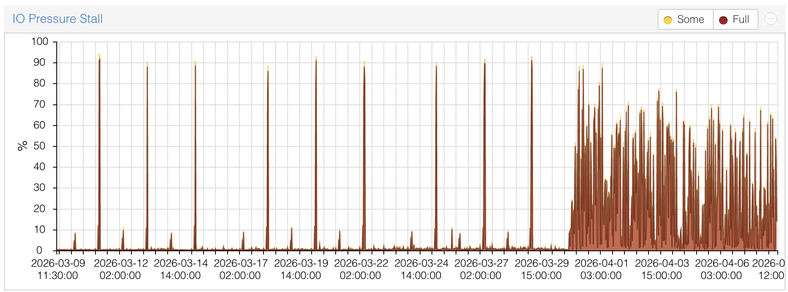
#Beszel agent was not reporting Disk I/O until the recent update. All agents are updating automatically, and that happened just around March 28-30. After that, the data began to flow.
In fact, I have sudden disk issues only with a single #Proxmox node, and it is clearly visible on the IO pressure stall graph. Spikes before May 30 are backups. Then it went crazy.