Climate's Unforeseen Consequence: Air Purity's Perilous Paradox
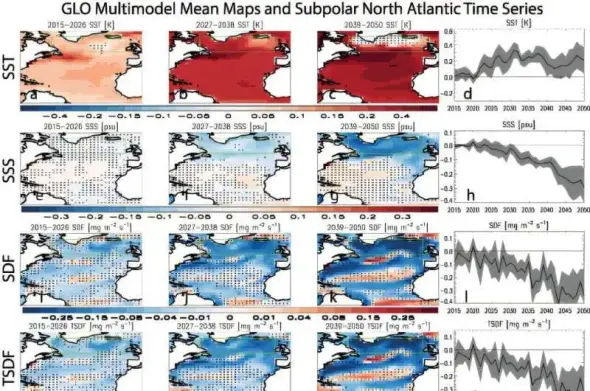
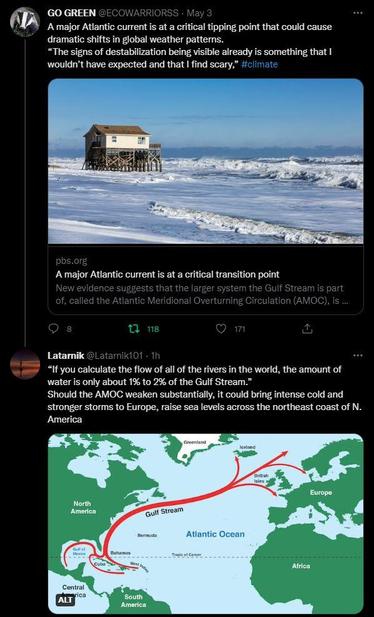
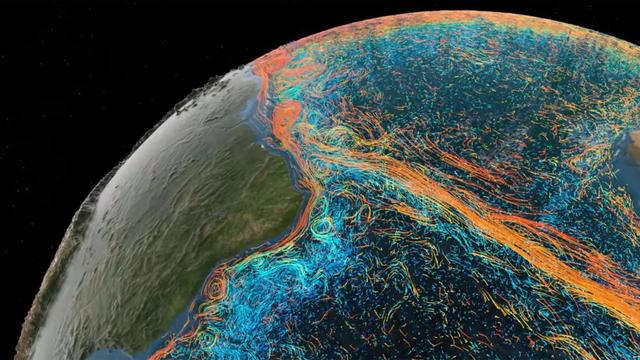
New research suggests cleaning air pollution could slow down a key Atlantic ocean current (AMOC), impacting weather globally. Who is affected?
#CleanAir, #OceanCurrents, #ClimateChange, #AMOC, #GlobalWeather
https://newsletter.tf/clean-air-efforts-weaken-atlantic-ocean-current/