Теодор Златанов / Ted Zlatanov

@tzz@infosec.exchange
72 Followers
197 Following
957 Posts

PSA: So you want to be a good kid, and understand that UNIX file system paths are kind wonky, and not stable references to inodes. So you drink the Linux cool-aid, and become a heavy O_PATH user: you pin all inodes via fds, validate them before you open them, use openat() heavily to get from one inode to descendents and are extra careful everywhere. And you think you saw the light.

But then one day, you realize, you *actually* have been doing it all wrong.

Both concepts (i.e. sysext + confext) exist for the system as a whole *and* per-service, managed automatically via portable services, or more manually by using the ExtensionImages=/ExtensionDirectories= unit file settings.

The latter makes a ton of sense for systemd-confext in particular: the set of configuration files for a service X should be associated with that service X, but still permit management of the code and configuration of X separately. And ExtensionImages=/ExtensionDirectories=…

…there are a couple of flags you can specify to alter how the command line is executed. These are denoted via special characters, such as "@", "-", ":", "+", "!" as first character of the setting's values. (Yes, this is a bit cryptic, we have to admit that).

With v258 we added one more such flag: "|" (i.e. the pipe symbol). If used, then instead of executing the specified command directly, it's invoked though the shell configured in the user database for the target user (i.e. the user…

Buzzfeed, pure class

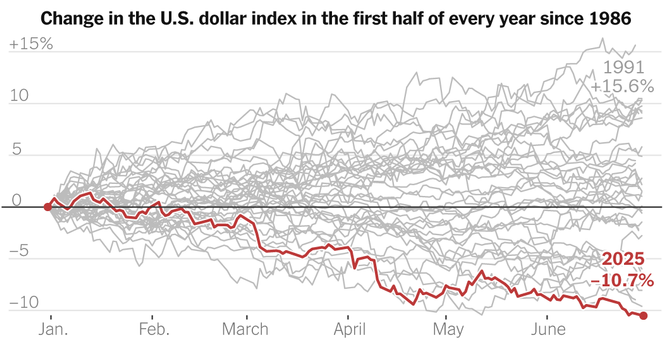
"The dollar is off to its worst start to a year in more than half a century.

US’ currency has weakened more than 10% over the past 6 mos when compared with a basket of currencies from the country’s major trading partners. The last time the dollar weakened so much at the start of the year was 1973, when US made a seismic shift and ended the linking of the dollar to the price of gold." https://www.nytimes.com/2025/06/30/business/dollar-decline-trump.html?smid=nytcore-ios-share&referringSource=articleShare

The Dollar Has Its Worst Start to a Year Since 1973

It has continued to slide even as President Trump has backed down from his tariff threats and the U.S. stock market has recovered from its losses.

The New York Times
So...Who's coming to OSDI/ATC next week?

What is the root¹ issue with agentic AI? by @Mer__edith

¹ no pun intended I swear

No es entonces simplemente un mercado?
Mr. Bezos, remember that you have a 30-day window for returns and exchanges.
×

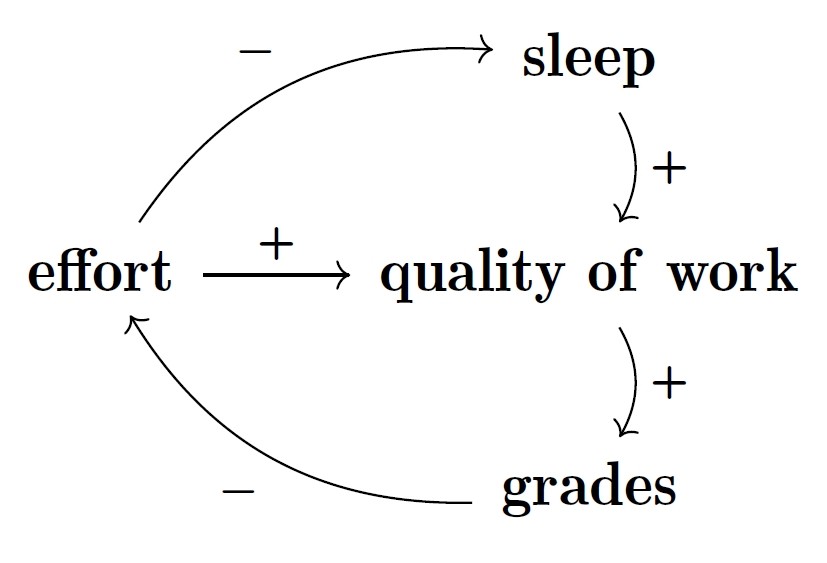
I've been working with @Adittya on modeling systems in this simple way, as graphs with edges labeled by signs {+,-} or element of more general monoids. Our paper is out now:

• John Baez and Adittya Chaudhuri, Graphs with polarities, http://math.ucr.edu/home/baez/polarities.pdf

Abstract. In fields ranging from business to systems biology, directed graphs with edges labeled by signs are used to model systems in a simple way: the nodes represent entities of some sort, and an edge indicates that one entity directly affects another either positively or negatively. Multiplying the signs along a directed path of edges lets us determine indirect positive or negative effects, and if the path is a loop we call this a positive or negative feedback loop. Here we generalize this to graphs with edges labeled by a monoid, whose elements represent ‘polarities’ possibly more general than simply ‘positive’ or ‘negative’. We study three notions of morphism between graphs with labeled edges, each with its own distinctive application: to refine a simple graph into a complicated one, to transform a complicated graph into a simple one, and to find recurring patterns called ‘motifs’. We construct three corresponding symmetric monoidal double categories of ‘open’ graphs. We study feedback loops using a generalization of the homology of a graph to homology with coefficients in a commutative monoid. In particular, we describe the emergence of new feedback loops when we compose open graphs using a variant of the Mayer–Vietoris exact sequence for homology with coefficients in a commutative monoid.

(5/n)

@johncarlosbaez

Yes, causal loop diagrams are great for getting a quick, strategic overview of how systems behave. They’re especially handy for clearly explaining complex interactions to decision-makers like managers or politicians in a way they actually get and don't flood them with too many details.

But if you need practical, actionable insights—like making detailed plans, justifying investments, or backing up big decisions—you’ll want to combine them with quantitative tools like Markov chains, Petri nets, or discrete-event simulations. These methods give you precise modeling, solid validation, and clear proof of what your decisions (especially investments!) will really do.

In the end, it's simple: If I put resource X into solving problem Y, what's gonna happen, and what else could that affect?

@Adittya

@johncarlosbaez @Adittya Fascinating! I have nothing useful to add except a lame joke: I suggest that if this turns into a fully fledged subfield, it be called "procrastimetetrics" and this type of diagram be called a "procrastinogram"

@moritz_negwer @johncarlosbaez

Thank you!!

"procrastimetetrics": Interesting!! 😂

Needless to say, this is interesting and valuable.

I wonder how this approach could be applied to Richard Gabriel's famous "worse is better".

I can't summarize it properly here, but in a sentence,
this is a thesis that
a partial solution that is available now and that can be improved later
often wins
over a complete solution that takes a long time to be produced.

#DoingTheRightThing
#WorseIsBetter

@johncarlosbaez @Adittya

@johncarlosbaez Your work and vision have inspired me in countless ways over the years. I’m deeply grateful to have had the opportunity to work with you and learn from you so closely. These last few months have been an incredibly exciting journey — I’ve learned so much, not just about research, but also from your guidance, insights, and advice. Thank you truly for everything!