The more cash you need, the more you want to borrow. In the short term this reduces your need for cash, but after a while it increases it. A vicious cycle.

The same pattern shows up all over the place, where a short-term fix makes the problem worse in the long run. This pattern is an example of a 'system archetype', and we can draw it as a diagram. Different instances of this archetype will give diagrams with different words - but the archetype is the pattern of edges with plus signs, minus signs and delays.

I've been working on the math of this stuff. I'm fascinated by how a general problem that haunts my life - I like to put off solving problems, and wind up making them worse - can be summarized as a simple diagram.

(1/n)

Here's another system archetype. There are two ways to solve a problem: a fundamental solution that takes a while to have any effect, and a quicker symptomatic solution... which unfortunately has a side-effect that makes the problem worse!

Like scratching a rash.

(2/n)

You can read about seven system archetypes here:

• Daniel H. Kim and Virginia Anderson, Systems Archetype Basics: From Story to Structure, https://thesystemsthinker.com/wp-content/uploads/2016/03/Systems-Archetypes-Basics-WB002E.pdf

It's worth a look; if you get the idea you can just look at the pictures and get the insights pretty fast. For example, the archetype here shows the essence of an arms race.

(3/n)

There's a general theory of these diagrams, which were called 'causal loop diagrams' by Sterman in his book Business Dynamics.

But similar diagrams are used in biology, where they are called 'pathways' or 'regulatory networks' or sometimes 'gene regulatory networks'. Here's part of the pathway for COVID. You can see the whole thing, and many more, here:

https://www.kegg.jp/pathway/map05171

(4/n)

I've been working with @Adittya on modeling systems in this simple way, as graphs with edges labeled by signs {+,-} or element of more general monoids. Our paper is out now:

• John Baez and Adittya Chaudhuri, Graphs with polarities, http://math.ucr.edu/home/baez/polarities.pdf

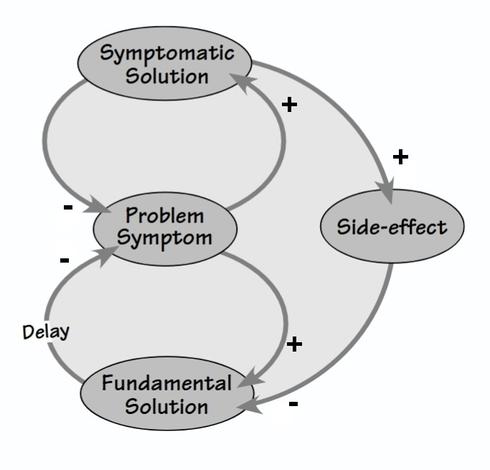
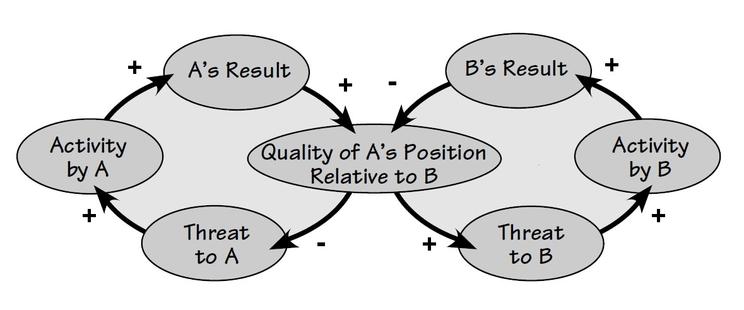
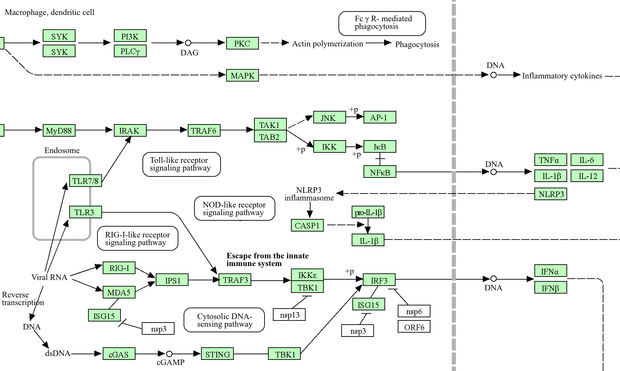
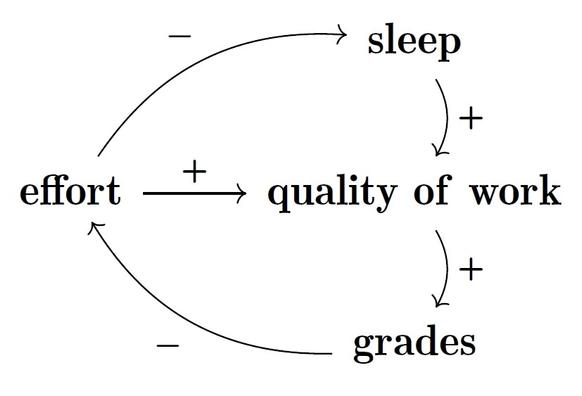
Abstract. In fields ranging from business to systems biology, directed graphs with edges labeled by signs are used to model systems in a simple way: the nodes represent entities of some sort, and an edge indicates that one entity directly affects another either positively or negatively. Multiplying the signs along a directed path of edges lets us determine indirect positive or negative effects, and if the path is a loop we call this a positive or negative feedback loop. Here we generalize this to graphs with edges labeled by a monoid, whose elements represent ‘polarities’ possibly more general than simply ‘positive’ or ‘negative’. We study three notions of morphism between graphs with labeled edges, each with its own distinctive application: to refine a simple graph into a complicated one, to transform a complicated graph into a simple one, and to find recurring patterns called ‘motifs’. We construct three corresponding symmetric monoidal double categories of ‘open’ graphs. We study feedback loops using a generalization of the homology of a graph to homology with coefficients in a commutative monoid. In particular, we describe the emergence of new feedback loops when we compose open graphs using a variant of the Mayer–Vietoris exact sequence for homology with coefficients in a commutative monoid.

(5/n)

@johncarlosbaez @Adittya Fascinating! I have nothing useful to add except a lame joke: I suggest that if this turns into a fully fledged subfield, it be called "procrastimetetrics" and this type of diagram be called a "procrastinogram"

@moritz_negwer @johncarlosbaez

Thank you!!

"procrastimetetrics": Interesting!! 😂