Hello, I am a statistician at Chalmers University of Technology and University of Gothenburg!
I work on scientific #machinelearning problems taking a Bayesian #statistics and causal inference perspective and contribute to #JuliaLang.

| Website | https://sethaxen.com |
| GitHub | https://github.com/sethaxen |
| https://twitter.com/sethaxen |
Hello, I am a statistician at Chalmers University of Technology and University of Gothenburg!
I work on scientific #machinelearning problems taking a Bayesian #statistics and causal inference perspective and contribute to #JuliaLang.
In ArviZ.jl we store inference results (especially #MCMC draws) as InferenceData. It's built on DimensionalData, so we have multidimensional real arrays with named dimensions. Each array element is a marginal of a random draw, which is a useful format for plotting, #statistics, and diagnostics, but sometimes it's useful to get back to a structure more like what a PPL might emit.
Surprisingly, we can get pretty close with just 8 lines of code:
https://github.com/arviz-devs/InferenceObjects.jl/issues/27
Just so y'all know, the lead Mastodon guy does this for a hilariously small amount of money. OSS is something else
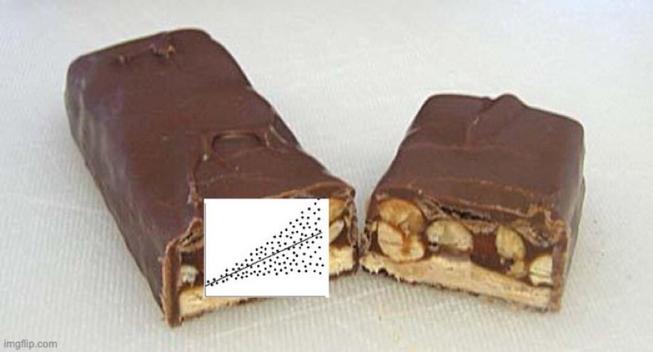
📢PARENTS📢
Make SURE you check your children's candy carefully this Halloween🍬
I just found HETEROSKEDASTICITY in this snickers bar😲😱
Hello everyone out there in the fediverse!
I'm currently a Academy of Finland postdoctoral fellow at Aalto University working on probabilistic #machinelearning. Most of my interests are related to probabilistic #machinelearning methods that are flexible (#nonparametric), efficient (#tractable), and exact or come with guarantees (or a subset of thereof).
In my research, I work a lot with #JuliaLang and I'm always eager to learn new things.
Curious to see where this all goes.
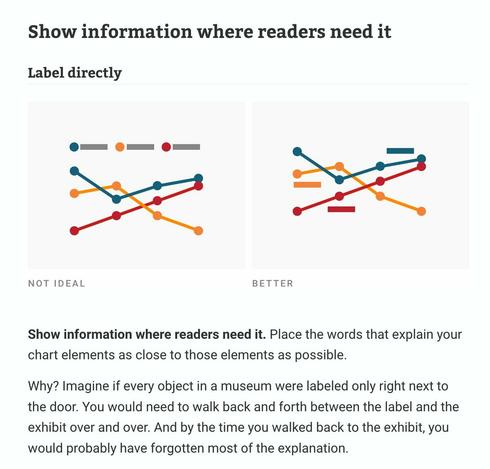
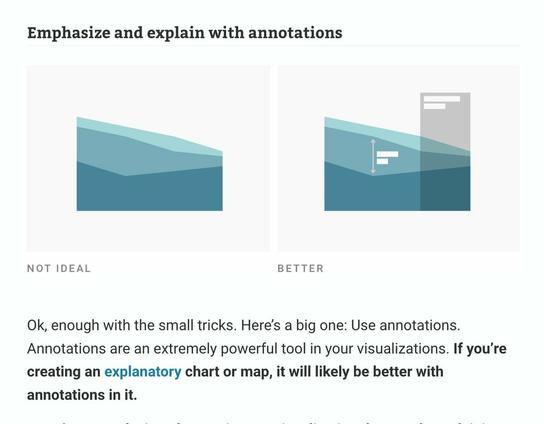
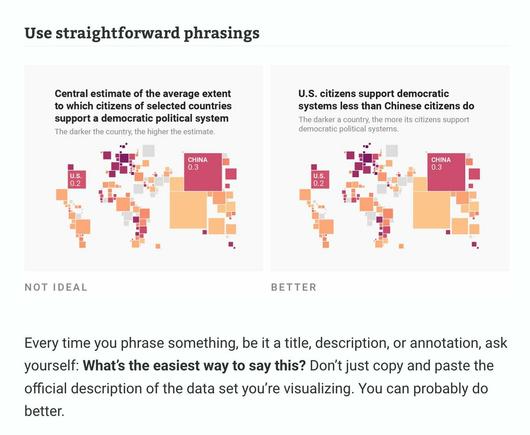
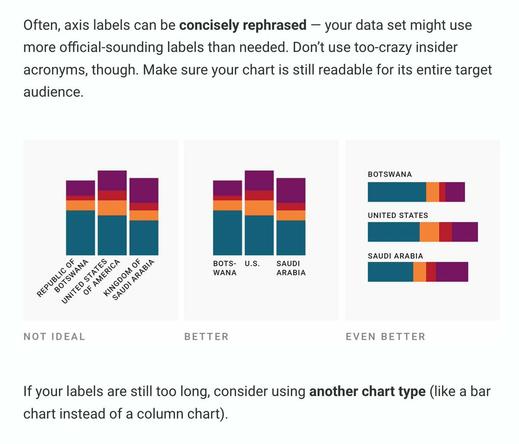
Text might be the most neglected part of #dataviz. We talk a lot about how the right chart type and colors can improve visualizations – but not enough about how to use words well.
So I wrote about that in my latest article: https://blog.datawrapper.de/text-in-data-visualizations/