Robin Gutzen

499 Followers
754 Following
55 Posts
Attacking the brain's mysteries with statistics and open-source tools; also dabbling in data visualizations, neuroart, and fermenting food.
websitehttps://rgutzen.github.io
linkedinhttps://www.linkedin.com/in/robin-gutzen/
orcidhttps://orcid.org/0000-0001-7373-5962
gravatarhttps://gravatar.com/rgutzen
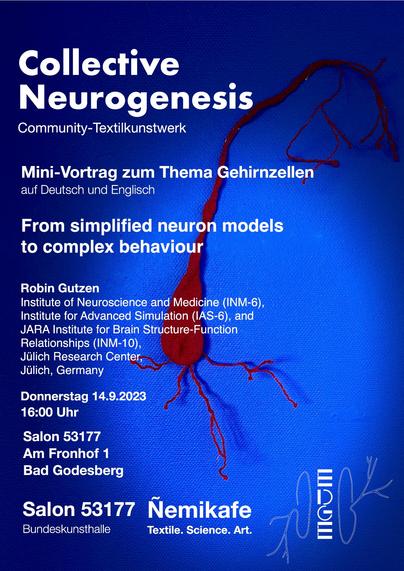
Tomorrow, I'll be giving a short introductory talk on why and how we model neurons in #neuroscience in a simplified way to the general audience of a #NeuroArt workshop. 👨‍🎨🧠
Where would you say are some limits of point neuron models in terms of what functions they may implement?
There are exciting #NeuroArt exhibitions and workshops happening in August (in Germany). There is the Sensorality series in Berlin https://edge-neuro.art/workshops/sensoriality/ and a workshop in Bonn on the interplay of #Neurosciene and #Art https://edge-neuro.art/edge-west-workshop-bonn-2023/
Sensoriality 2023: Art and Neuroscience through our Senses. - EDGE

We are thrilled to announce that our second version of Sensoriality is here! Unlock the secrets of your senses with us, in the second version of Sensoriality: Art and Neuroscience through our Senses. About the Series: A 6-part workshop series starting with an exhibition from the EDGE community. As we navigate our world, our senses … Continue reading Sensoriality 2023: Art and Neuroscience through our Senses. →

EDGE
Additionally, the test can also compare synaptic weight matrices.
In rewiring experiments, we measure which connectivity properties have an over- or under-proportional effect on the spiking correlations.
Thus, presenting a means to measure the effects of the network dynamics 🧠🕸
5/5
We demonstrate how the similarity score correctly indicates correlated subgroup structures between network realizations.
The test complements classical tests (e.g. Kolmogorov-Smirnov) because it compares the organization of correlations in a network instead of just the amount.
4/5
Imagine the correlation matrices for two sets of N spike trains.
When they are similar, their respective eigenvectors (ev) are more aligned, i.e, the angles between ev pairs are small.
Thus we can quantify similarity by angle-smallness, compared to random angles in N-dim space 📐
3/5
... We demonstrate this adaptable pipeline approach by comparing the #SlowWave dynamics across multiple #OpenAccess #ECoG and #CalciumImaging datasets of anesthetized mice. In this meta-analysis, we can identify the influences of experimental parameters such as the anesthetic type and dosage and the spatial resolution of the recording technique.
The pipeline development is #opensource (#Python) and is already being reused for other research applications. ...
2/3