is it e-graph or egraph

Paul Khuong
@pkhuong@discuss.systems
- 439 Followers
- 357 Following
- 1.7K Posts
*Boosts very welcome*
A collective I am part of is looking for a SuperMicro X11 server. We're hoping to find a second-hand one we could buy!
Does any of you tech people know where one could buy a second-hand SuperMicro X11 server? Or knows a company that might be getting rid of their old ones?
If you have leads on an X12, we would also like to hear about it.
Ideal situation would be in Montreal, so we could pick it up, but also open to hearing about any and all opportunities!
I think I have a design problem that wants an ECS. Tell me why I'm wrong :D
@cfbolz When sampling at a fixed byte period, I worry about aliasing between the fixed-period sampling process and the profilee's potentially periodic allocation pattern. Does PyPy naturally introduce enough nondetermism to make that a non-issue?
https://mastoxiv.page/@arXiv_csPL_bot/114731825902548197
https://mastoxiv.page/@arXiv_csPL_bot/114731825902548197
arXiv cs.PL bot (@arXiv_csPL_bot@mastoxiv.page)
Low Overhead Allocation Sampling in a Garbage Collected Virtual Machine Christoph Jung, C. F. Bolz-Tereick https://arxiv.org/abs/2506.16883 https://arxiv.org/pdf/2506.16883 https://arxiv.org/html/2506.16883 arXiv:2506.16883v1 Announce Type: new Abstract: Compared to the more commonly used time-based profiling, allocation profiling provides an alternate view of the execution of allocation heavy dynamically typed languages. However, profiling every single allocation in a program is very inefficient. We present a sampling allocation profiler that is deeply integrated into the garbage collector of PyPy, a Python virtual machine. This integration ensures tunable low overhead for the allocation profiler, which we measure and quantify. Enabling allocation sampling profiling with a sampling period of 4 MB leads to a maximum time overhead of 25% in our benchmarks, over un-profiled regular execution. toXiv_bot_toot
Since execution performance is readily quantified, it is most often measured and optimized--even when increased performance is of marginal value; viz. ("Dubious Achievement", Comm. of the ACM 34, 4 (April 1991), 18.)
Smart of the authors to wait until page 4 to introduce a novel fraktur-themed concept. Now too invested to nope out
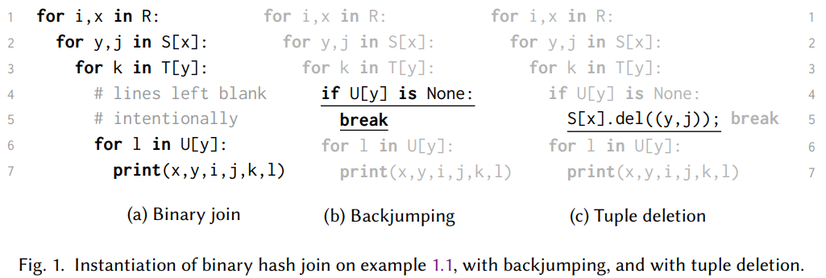
[arXiv] TreeTracker Join: Simple, Optimal, Fast
https://arxiv.org/abs/2403.01631
TreeTracker gives a very simple breakdown of what the core differences are between a naive binary join and an optimal multi-way join.
Boxed types, what's the history / origin?
I can't find anything on https://en.wikipedia.org/wiki/Boxing_(computer_programming)
tips or hints?
What's the state of Java decompilation these days, can I finally Just Do It?
By which I mean, take a Java binary, run it through the decompiler, directly compile its output and without manual intervention it Just Works. Previous problems include (but are not limited to) the output of the decompiler being bare Java source not contained in a project, obfuscated names being invalid identifiers, uninitialized variables tripping up the Definite Assignment logic despite never actually being read..
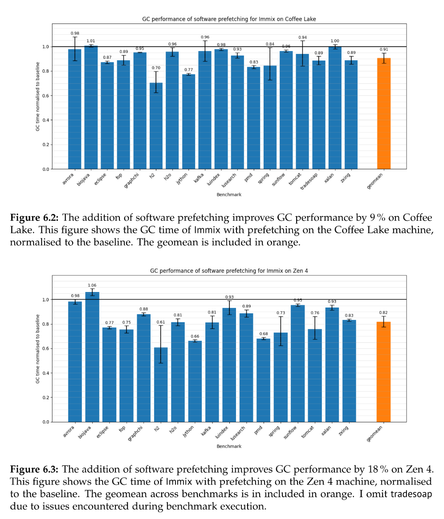
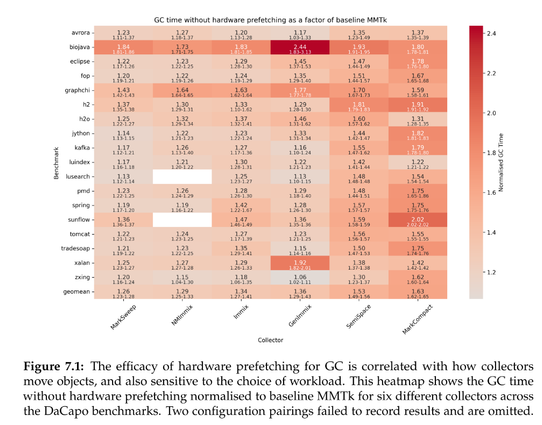
Claire Huang wrote an undergraduate honor's thesis, supervised by @steveblackburn and @caizixian https://www.steveblackburn.org/pubs/theses/huang-2025.pdf
She uses sampling PEBS counters and data linear addressing (DLA) on Intel chips to attempt to understand the structure and attribution of load latencies in MMTk.
After identifying L1 misses in the trace loop as a significant overhead, she adds prefetching and reduces GC time by 10% or so across a range of benchmarks, and more on Zen4.