📊 The Royal Statistical Society has just released its "Data Visualization Guide”. Find it here: https://royal-statistical-society.github.io/datavisguide/docs/
This might come in handy for anyone interested in data viz best practices.

📊 The Royal Statistical Society has just released its "Data Visualization Guide”. Find it here: https://royal-statistical-society.github.io/datavisguide/docs/
This might come in handy for anyone interested in data viz best practices.
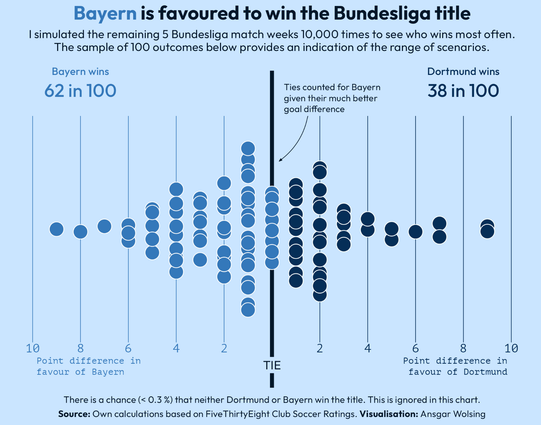
I simulated the remaining 5 Bundesliga match weeks 10,000 times and sampled 100 outcomes.
Bayern wins 62 in 100, Dortmund 38 in 100 samples.
Match results simulated based on FiveThirtyEight Club Soccer Ratings.
#30DayChartChallenge | day 29: monochrome | #rstats #dataviz #ggplot2
Number of people living in autocracies and democracies 🌎🗳️🗽
Distribution of political regime types from 1800 to 2022.
#30DayChartChallenge | day 06: Data Day: OWID | #rstats #dataviz
Erling Haaland's player ratings in EA Sports FIFA ⚽️
Already reaching the career mode potential. 🚀
#30DayChartChallenge | day 20: correlation | #rstats #dataviz
CO2 emissions since the Industrial Revolution 🌎🌱💨
#30DayChartChallenge | day 19: Anthropocene | #rstats #dataviz #datavisualization #ggplot2
Who speaks about whom in The Office
What better time to share a chart about #TheOffice than lunchtime? 📊🍝
Chord diagrams showing who the main characters* mention by name. Thickness of the lines indicate frequency.
(*by lines)
#30DayChartChallenge | day 17: networks | #rstats
Ever wondered if there are more colours in LEGO these days?
My son and I built 2 treemaps: the number of different colours in LEGO sets has increased significantly over the last few decades.
#rstats for data processing +🧱+📸+ #Figma
#30DayChartChallenge | day 16: family
#lego #bricks #dataviz #datavisualization