Ross Wardrup

@GeoEpi
21 Followers
5 Following
33 Posts
Spatial Epidemiology Grad Student & GIS Nerd. Mapping health trends, uncovering data stories, and exploring how place impacts wellness.
Websitehttps://www.rwardrup.com

My preprint, "Spatial Patterns of COVID-19 Mortality: Socioeconomic Determinants in U.S. Counties," is now on medRxiv.

This research examines how factors like insurance, race, and income relate to COVID-19 mortality trends, highlighting key health disparities.

Read here: https://www.medrxiv.org/content/10.1101/2024.10.30.24316443v1

Feedback welcome as it enters peer review! #COVID19Research #Epidemiology #PublicHealth

Spatial Patterns of COVID-19 Mortality: Examining Socioeconomic Determinants in U.S. Counties Using Cluster Analysis

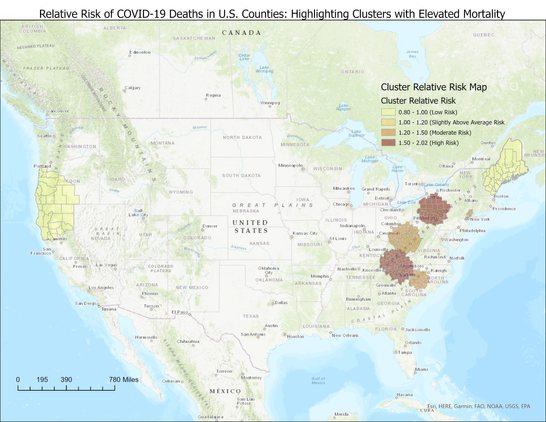
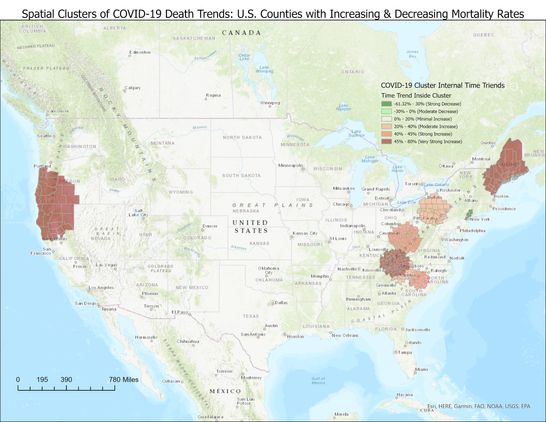
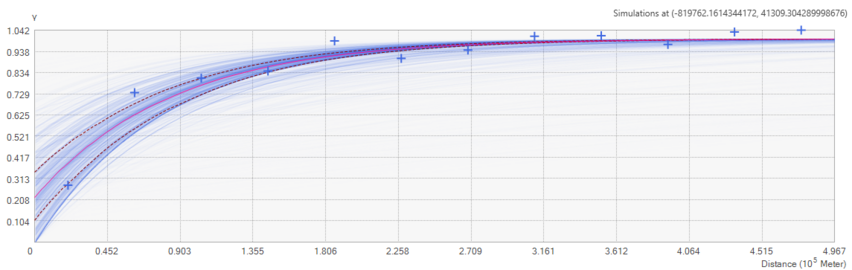
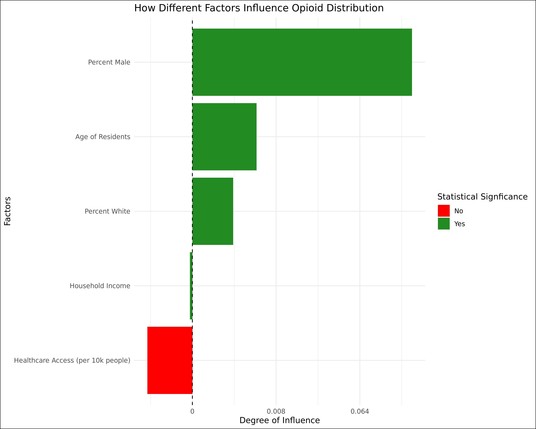
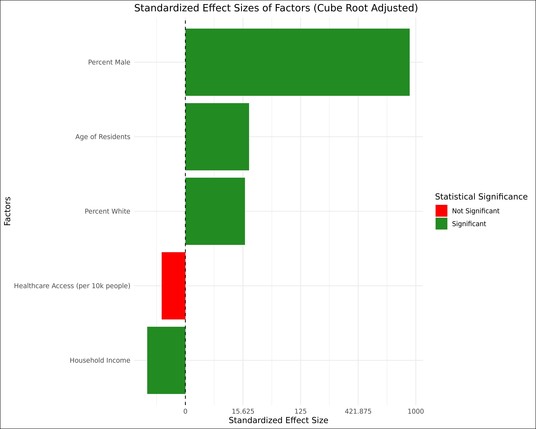
Abstract Aim: This study aims to investigate the spatial patterns of COVID-19 mortality across U.S. counties and identify the socioeconomic determinants that influence these mortality trends, using spatial epidemiological methods. Subject and Methods: We conducted a spatial analysis of COVID-19 mortality data from over 3,000 U.S. counties, applying cluster detection techniques, including SatScan, to identify areas with significant mortality trends. Spatial regression models, including spatial lag and spatial error models, were employed to examine the impact of socioeconomic variables, such as race, income inequality, and insurance rates, on COVID-19 mortality. The analysis controlled for multicollinearity and spatial autocorrelation in the data. Results: Counties with higher proportions of Black populations and higher uninsured rates exhibited significantly lower COVID-19 trends over the study period. Spatial clustering revealed regions in the northwestern and eastern/northeastern United States with a mix of positive and negative mortality rate trends. The spatial lag model showed the strongest fit, confirming the importance of spatial dependency in explaining mortality patterns. Conclusion: This study highlights the significant spatial disparities in COVID-19 mortality across U.S. counties. The findings emphasize the need for targeted public health interventions in vulnerable regions to address these disparities. Keywords: COVID-19 mortality, socioeconomic status (SES), spatial regression, health disparities, spatial clusters ### Competing Interest Statement The authors have declared no competing interest. ### Funding Statement This study did not receive any funding. ### Author Declarations I confirm all relevant ethical guidelines have been followed, and any necessary IRB and/or ethics committee approvals have been obtained. Yes I confirm that all necessary patient/participant consent has been obtained and the appropriate institutional forms have been archived, and that any patient/participant/sample identifiers included were not known to anyone (e.g., hospital staff, patients or participants themselves) outside the research group so cannot be used to identify individuals. Yes I understand that all clinical trials and any other prospective interventional studies must be registered with an ICMJE-approved registry, such as ClinicalTrials.gov. I confirm that any such study reported in the manuscript has been registered and the trial registration ID is provided (note: if posting a prospective study registered retrospectively, please provide a statement in the trial ID field explaining why the study was not registered in advance). Yes I have followed all appropriate research reporting guidelines, such as any relevant EQUATOR Network research reporting checklist(s) and other pertinent material, if applicable. Yes All data produced are available online at https://www.rwardrup.com/download/data-r-code-for-covid-19-spatial-clusters-ses/

medRxiv

As part of my ongoing research, I’ve mapped U.S. county clusters showing significant spatial variations in COVID-19 mortality trends and relative risk (RR) in CONUS counties between 2020 and 2022. RR > 1 indicates higher mortality than expected, while RR < 1 suggests lower. Notably, counties around NYC show a strong decreasing trend, while regions with RR > 1 continue to face rising mortality rates.

#Epidemiology #COVID19 #PublicHealth #GIS #SpatialAnalysis #HealthEquity

Healthcare Accessibility in Colorado

Key findings from my study:

Spatial Dependence: Access in one area affects neighboring areas.
Disparities: Older and lower-income populations face reduced access.
Racial Composition: Access varies for different minority groups.

We need better regional planning for equitable healthcare!

https://www.rwardrup.com/healthcare-accessibility-colorado/

#Epidemiology #PublicHealth #Research

Socio-Demographic Determinants and Spatial Dependencies of Healthcare Facility Accessibility in Colorado - Ross Wardrup

Discover insights into healthcare accessibility in Colorado, highlighting key socio-demographic factors and the importance of regional planning and targeted interventions.

Ross Wardrup
What I was surprised about most in my vaccine exemption work is the negative correlation between the percentage of people with a ninth grade education or less, and the percentage of students with non-medical MMR and DTaP exemptions.

Rural Residence and Non-Medical Exemptions: Living in rural areas correlates with higher rates of vaccine exemptions, according to my latest research. Plus, clusters of high rates of vaccine exemptions were detected in SW Colorado.

This highlights the unique challenges faced in these communities and the need for targeted public health efforts.

https://www.rwardrup.com/colorado-vaccine-exemptions-study/

#Epidemiology #PublicHealth #GIS

Socioeconomic Influences on Non-Medical School Vaccination Exemption Hotspots in Colorado: A Spatial & Statistical Examination - Ross Wardrup

Discover key insights from our 2024 study on Colorado's non-medical vaccine exemptions and their impact on public health strategies.

Ross Wardrup

Super happy with the semivariogram I was able to get with the spatial empirical Bayes smoothed rates of MMR vaccination exemptions in Colorado!

The kriging model coming out of this looks great.

#GIS #Geostatistics #Epidemiology

In my latest work, I look into how location and socioeconomic factors influence opioid distribution in the US. It’s an insightful look at the data behind public health strategies.

Take a look and feel free to share your thoughts.

https://www.rwardrup.com/opioid-epidemic-spatial-analysis/

#OpioidCrisis #PublicHealth #Epidemiology

Charting the Opioid Terrain: A Decade of Hydrocodone and Oxycodone Distribution Patterns Across the U.S. - Ross Wardrup

Discover how spatial data shapes our understanding of the opioid epidemic and guides targeted interventions.

Ross Wardrup

Here are the results of my latest project which looked at spatial and socioeconomic factors of opioid distribution in the US.

More details upcoming, but these are the highlights.

#Epidemiology #PublicHealth #OpioidCrisis

My progress on my current project has been derailed by SQL database issues. I’ve had to migrate all of my data to a new server, and then realized the underlying ZFS file system wasn’t performant enough. So I then had to reinstall on btrfs and things are blazingly fast!