The app that controls and reports on the dance that takes place between my solar panels, the battery system, the heat pump, the house and the grid has many simple graphs (usually comparing just two things). I say that because I know that some may complain this one, knitting everything together, is overwhelmingly complex. After a few days, however, I’ve come to appreciate what it does, displaying the phases of operation in a single day. Read on as I explain…
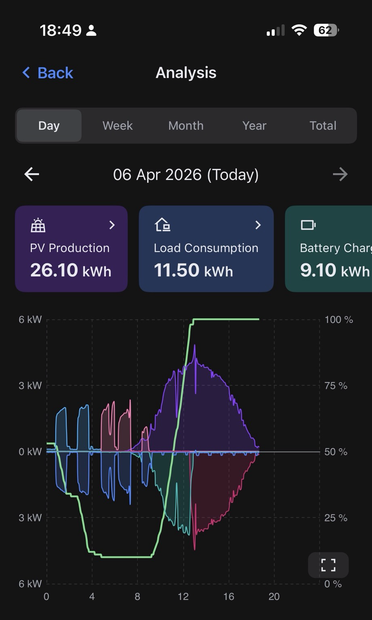
The easy one first: The bright green line shows the state of charge of the battery. The SOC was 100% at this time last night. At that time solar generation ended and the house was essentially off grid with the battery meeting all demands. In this graph it had already depleted to about 50% at midnight (far left) and you see it steadily dropping to the 10% safety margin by about 4.50am. It stays there with the house now now drawing grid power until around 9am when the solar comes back on in ..
..sufficient strength to charge the battery back up. Solar provid3d enough power to completely recharge the battery by noon. I had hoped the battery would last till the solar came back on for a full 24 hours without the grid but last night was very cold and so the heat pump drew more power to keep the house a constant 19C. Tonight is milder and I hope for success this time. As to the rest of the graph, things above the x-axis are sources of power which we aim to juggle: solar, battery and grid.
.. The commodities below the 0kW axis are places using power: grid export, charging the battery and the domestic load, which includes the heat pump. The four pulsing blips on the plot between midnight and 8am are cycles of the heat pump. This draws a variable load accord8ng to how hard it has to work and you see here that the negative excursions are loads of about 1.5-1.75kW heating the radiators. These are mirrored by bursts of battery discharge to provide the power. Each burst reduces the %SOC
Just before 5am the battery was depleted so the third and fourth heat pump cycles are powered instead by the grid. Just after 9am solar was ramping up though so the fifth smaller cycle is part powered by solar and part by the grid. After that it’s warm enough outside that the heat pump doesn’t come back on again till later this evening, when the cycle starts again. From 9am the big purple bell shape curve is the typical daily cycle of solar. The power increases rapidly with the rising sun.
Below the purple bell shape the rapid 8ncrease in power is being used to recharge the battery (watch the green SOC line). In fact the battery is full by noon so now there is nowhere else for the power to go except onto the grid as an ‘export’. The house continues pushing electricity out onto the grid from noon till around 7pm when I took this screenshot. From here the battery takes over again, powering everything through the night. As I said, tonight I predict the heat pump will need less ..
..power and the battery will get to continue running the house till the solar comes back on. The savings are twofold: first there is the money not spent importing grid power. Today I’ve used only 50p worth of power and tomorrow I hope that’s zero. Second, I’m hoping it won’t be long before I get paid the the exported power. Today I sent the grid 14kWh and, whilst I won’t get as much as I pay to import the same amount, the numbers are not that far apart. Over time this will offset what I bought..
..in the darker colder months. A third factor is that even in the depths of winter the battery will help me to ensure all the electricity I import is from low price periods of the tariff — roughly half the standard tariff price. Couple in the greater efficiency of the heat pump and you’ll see that there is not one but several factors that combine to maximise the savings. This is why the numbers each day are going into a set of spreadsheets so I can understand how to tune the setup.