Today is the International Day for #BiologicalDiversity!

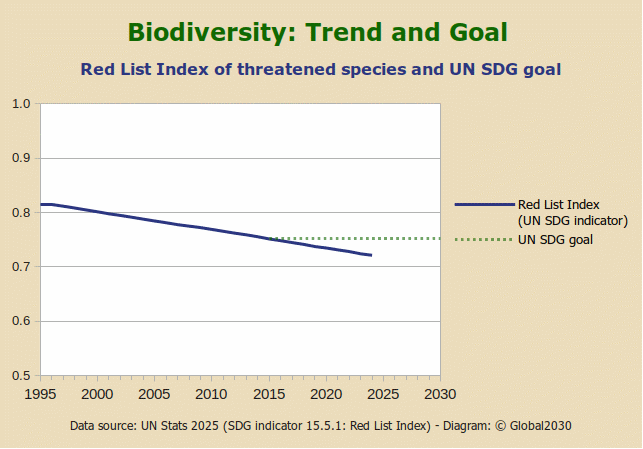
The #RedListIndex of #ThreatenedSpecies shows a continuous #decline from 0.82 in 1995 to 0.72 in 2024📉 (UN).

This negative #trend is not in line with the @UN #SDG aim to “halt the #loss of #biodiversity”⛔.

#GlobalGoals #SDGs #2030Agenda #SDG15 #RedList #KMGBF #biodiv #wildlife #nature
Data source: https://unstats.un.org/sdgs/dataportal/database
UNSDG

@global2030 please label you axis, come on, right now I am just looking at drawing with line in it and no idea what is represents. What are the numbers there? I guess the bottom is for years, but vertical? No clue.

Just tell me what I am looking at.

@atomicfs
Well, you are right that the horizontal axis of the trend diagram shows the years. The vertikal axis is the Red List Index of threatened species mentioned in the subtitle, the legend, the data source and the "ALT" text of the diagram as well as in the text of the post.
If you want to know more about the index, it is based on the well-known Red List of Threatened Species by IUCN, which has been available since 1964. The Red List Index (RLI) by IUCN enables trend assessments. ...
@atomicfs
... It reflects the probability of species survival. An RLI value of 1.0 equates to all species qualifying as Least Concern (i.e., not expected to become Extinct in the near future). An RLI value of 0 equates to all species having gone Extinct. If the rate of biodiversity loss were reducing, the RLI would show an upward trend. The UN has adopted the RLI as the official indicator for its Sustainable Development Goal (SDG) 15 to “halt the loss of biodiversity”.
@global2030 I understood that it was a index thing, but I had no idea what it meant.
Thank you were much for this nice explanation, what 1.0 means and 0.0, this makes it so much easier to understand the graph.
Thanks!