

#CA17 Ro Khanna (D)
@khanna.house.gov
FYI, I looked it up, & sure enough CA-17 is the wealthiest Congessional District in the country, which presuably explains the massive Employer insurance enrollment & tiny Medicare/Medicaid & uninsured numbers.
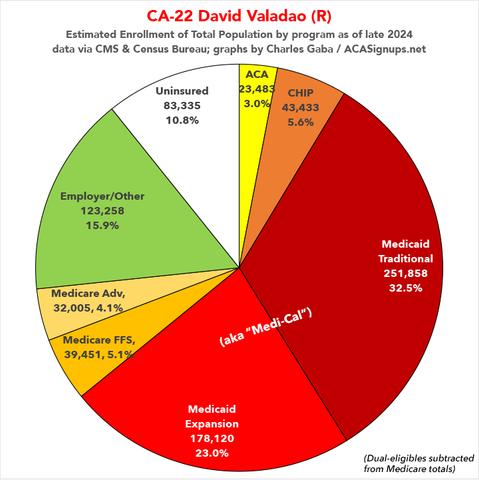
#CA22 David Valadao (R)
Yes, that's correct: In one of the most competitive GOP-held districts in the country, a whopping 64% of the entire population is enrolled in either Medicaid/CHIP or ACA exchange coverage.
#CA27 George Whitesides (D)
@georgewhitesides.bsky.social


Reminder: If you find my healthcare wonkery useful & would like to support it, you can do so once or monthly here, thanks!!
secure.actblue.com/donate/acasignups
I just supported Charles Gaba'...
I just supported Charles Gaba'...
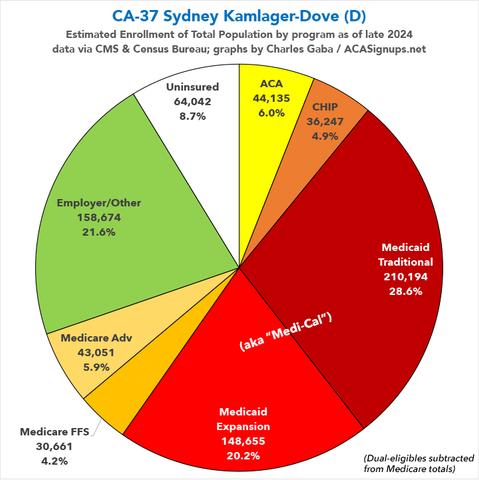
#CA37 Sydney Kamlager-Dove (D)
@repkamlagerdove.bsky.social


Whew! California is now complete!
Going forward I'll be posting individual threads for each state & then quote-posting the starting post for each thread into this one.
73 down, 363 left to go...
All 8 COLORADO districts now available:
bsky.app/profile/char...
RE: https://bsky.app/profile/did:plc:kd4cyu4rpkgjbym3gckhrivz/post/3ljiagpcftc2s
RE: https://bsky.app/profile/did:plc:kd4cyu4rpkgjbym3gckhrivz/post/3ljiagpcftc2s
All 5 CONNECTICUT districts now available:
bsky.app/profile/char...
RE: https://bsky.app/profile/did:plc:kd4cyu4rpkgjbym3gckhrivz/post/3ljihwnlchs2e
RE: https://bsky.app/profile/did:plc:kd4cyu4rpkgjbym3gckhrivz/post/3ljihwnlchs2e
DELAWARE'S sole House district now available:
bsky.app/profile/char...
RE: https://bsky.app/profile/did:plc:kd4cyu4rpkgjbym3gckhrivz/post/3ljim4jbr7k2j
RE: https://bsky.app/profile/did:plc:kd4cyu4rpkgjbym3gckhrivz/post/3ljim4jbr7k2j

Charles Gaba ✡️ (@charlesgaba.com)
📣 New State Added: I've completed pie charts breaking out total population enrollment in Medicaid, CHIP, Medicare & ACA exchange plans for #DELAWARE: #DE-AL Sarah McBride (D) Sen. Chris Coons Sen. Lisa Blunt Rochester @mcbride.house.gov @bluntrochester.senate.gov https://acasignups.net/cd-pie-charts/de
DISTRICT OF COLUMBIA now available:
bsky.app/profile/char...
RE: https://bsky.app/profile/did:plc:kd4cyu4rpkgjbym3gckhrivz/post/3ljiqf3pscs2j
RE: https://bsky.app/profile/did:plc:kd4cyu4rpkgjbym3gckhrivz/post/3ljiqf3pscs2j
WHOOPS! I forgot to keep updating the main thread; playing catch-up now:
All #FLORIDA districts now available:
bsky.app/profile/char...
RE: https://bsky.app/profile/did:plc:kd4cyu4rpkgjbym3gckhrivz/post/3ljko2ipwfc2j
RE: https://bsky.app/profile/did:plc:kd4cyu4rpkgjbym3gckhrivz/post/3ljko2ipwfc2j
All #GEORGIA districts now available:
bsky.app/profile/char...
RE: https://bsky.app/profile/did:plc:kd4cyu4rpkgjbym3gckhrivz/post/3ljncxne3u22t
RE: https://bsky.app/profile/did:plc:kd4cyu4rpkgjbym3gckhrivz/post/3ljncxne3u22t
Both #HAWAII districts now available
bsky.app/profile/char...
RE: https://bsky.app/profile/did:plc:kd4cyu4rpkgjbym3gckhrivz/post/3ljnlltovuc2t
RE: https://bsky.app/profile/did:plc:kd4cyu4rpkgjbym3gckhrivz/post/3ljnlltovuc2t
Both #IDAHO districts now available (updated):
bsky.app/profile/char...
RE: https://bsky.app/profile/did:plc:kd4cyu4rpkgjbym3gckhrivz/post/3ljnna2yzls2t
RE: https://bsky.app/profile/did:plc:kd4cyu4rpkgjbym3gckhrivz/post/3ljnna2yzls2t
All 17 #ILLINOIS districts now available:
bsky.app/profile/char...
RE: https://bsky.app/profile/did:plc:kd4cyu4rpkgjbym3gckhrivz/post/3ljqdnaknp22e
RE: https://bsky.app/profile/did:plc:kd4cyu4rpkgjbym3gckhrivz/post/3ljqdnaknp22e
All 9 #INDIANA districts now available:
bsky.app/profile/char...
RE: https://bsky.app/profile/did:plc:kd4cyu4rpkgjbym3gckhrivz/post/3ljsir3mtd223
RE: https://bsky.app/profile/did:plc:kd4cyu4rpkgjbym3gckhrivz/post/3ljsir3mtd223
All 4 #IOWA districts now available:
bsky.app/profile/char...
RE: https://bsky.app/profile/did:plc:kd4cyu4rpkgjbym3gckhrivz/post/3ljsw5e3gm223
RE: https://bsky.app/profile/did:plc:kd4cyu4rpkgjbym3gckhrivz/post/3ljsw5e3gm223
All 4 #KANSAS districts now available:
bsky.app/profile/char...
RE: https://bsky.app/profile/did:plc:kd4cyu4rpkgjbym3gckhrivz/post/3ljt2l3z2os2q
RE: https://bsky.app/profile/did:plc:kd4cyu4rpkgjbym3gckhrivz/post/3ljt2l3z2os2q
All 6 #KENTUCKY districts now available:
bsky.app/profile/char...
RE: https://bsky.app/profile/did:plc:kd4cyu4rpkgjbym3gckhrivz/post/3ljt66e6bfk2q
RE: https://bsky.app/profile/did:plc:kd4cyu4rpkgjbym3gckhrivz/post/3ljt66e6bfk2q
All 6 #LOUISIANA districts now available (including Speaker Mike Johnson's):
bsky.app/profile/char...
RE: https://bsky.app/profile/did:plc:kd4cyu4rpkgjbym3gckhrivz/post/3ljupasapa22q
RE: https://bsky.app/profile/did:plc:kd4cyu4rpkgjbym3gckhrivz/post/3ljupasapa22q
IMPORTANT: I should note that I also have the STATEWIDE charts for each state at the bottom of the page, below the individual districts, except in states with only one district of course.
Also, I've gone back and made some updates/tweaks to some of the earlier states; obviously I can't edit the versions posted upthread, but the new versions are available at the links for each state:
acasignups.net/program-enro...
Pie Charts Galore! Medicaid, C...
Pie Charts Galore! Medicaid, C...

Pie Charts Galore! Medicaid, CHIP, ACA & Medicare enrollment by Congressional District
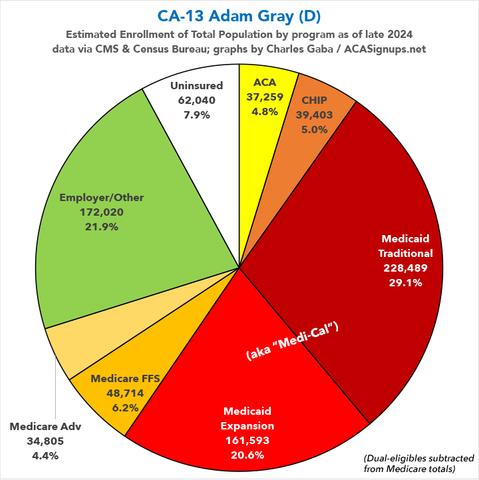
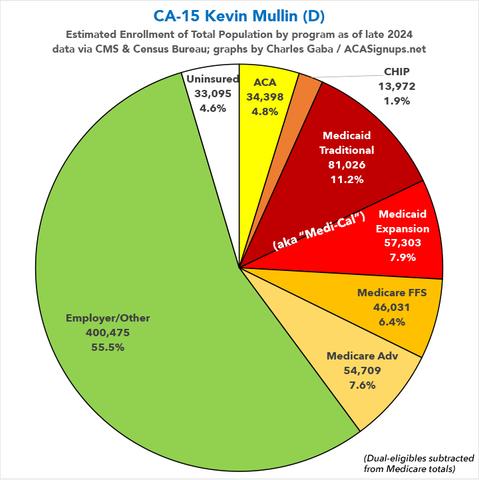
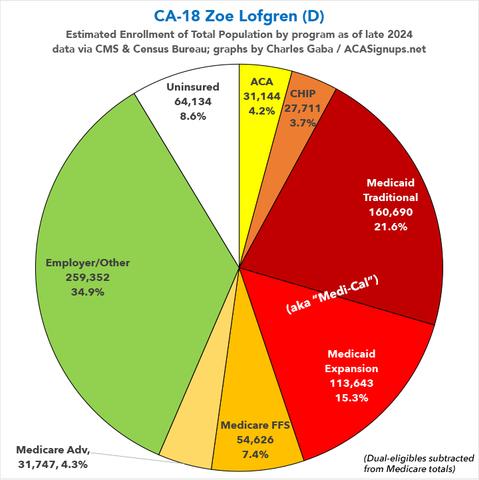
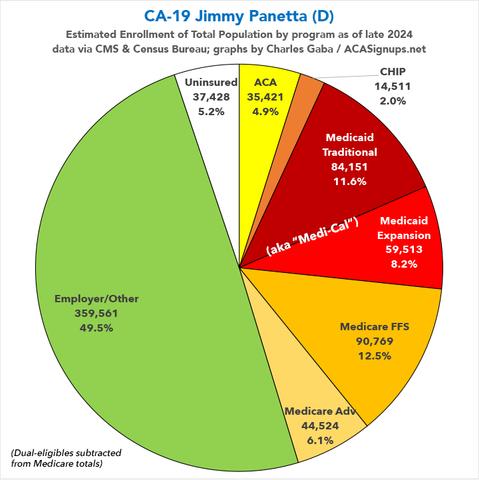
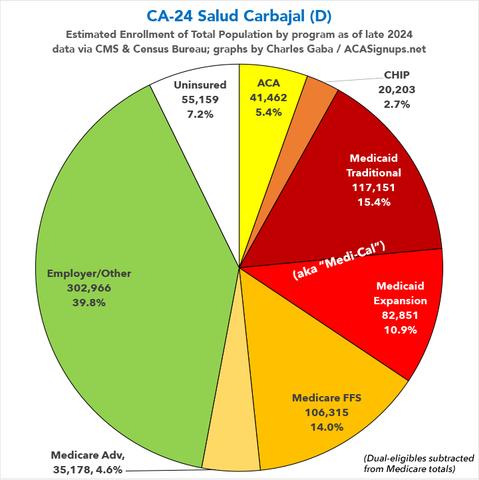
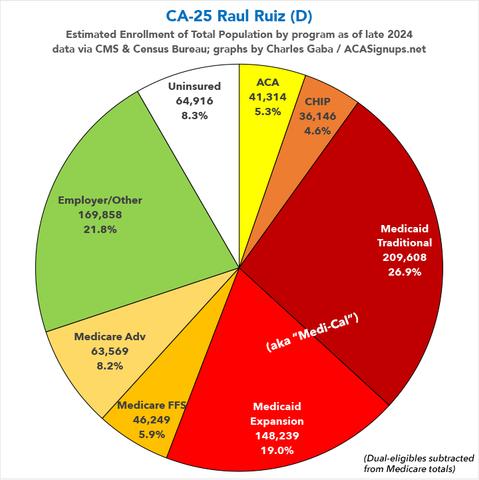
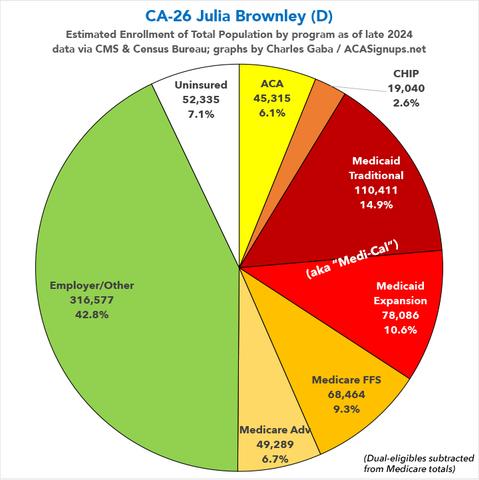
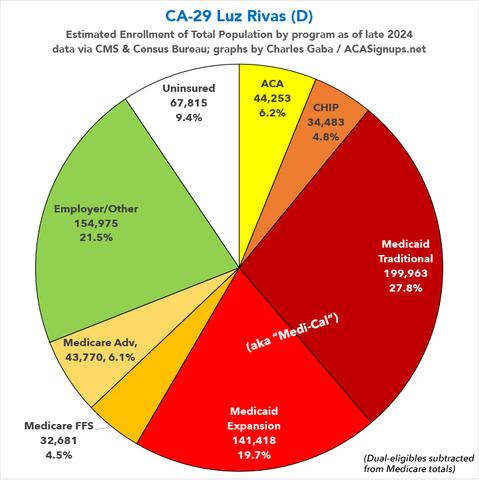
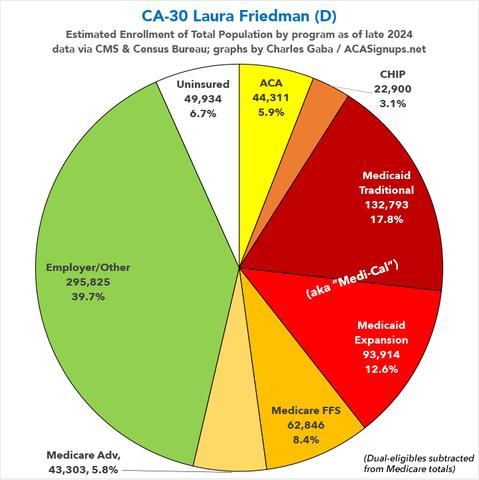
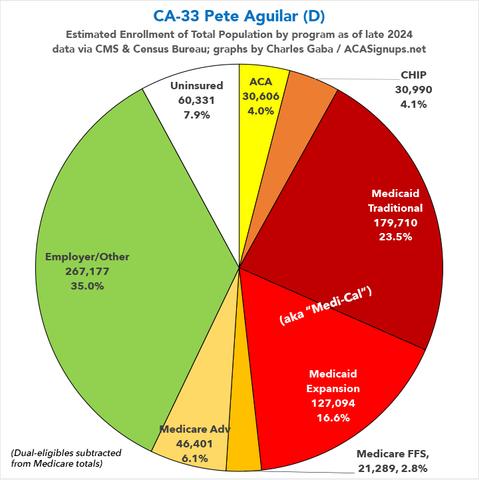
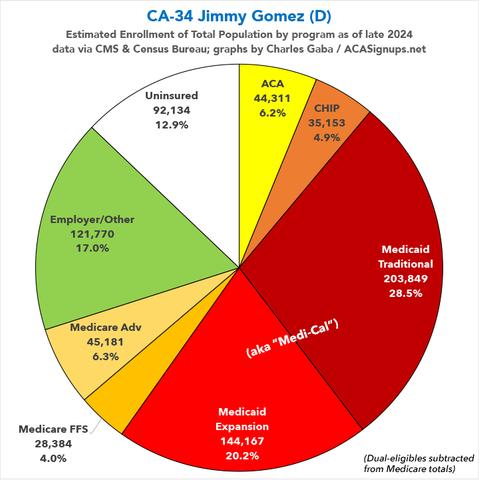
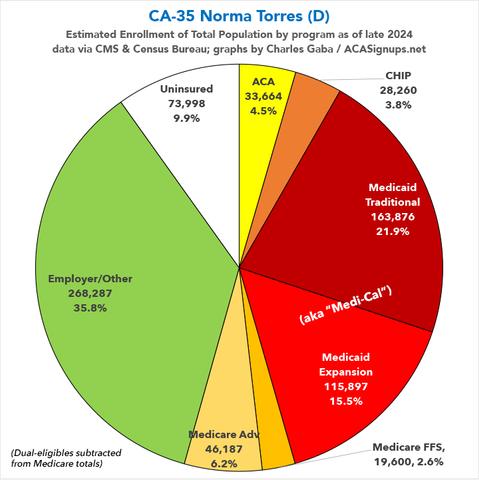
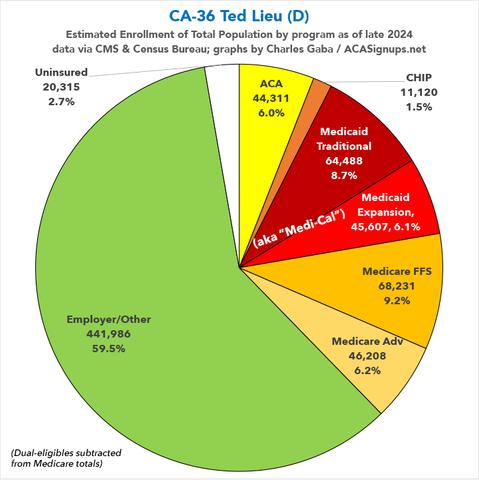
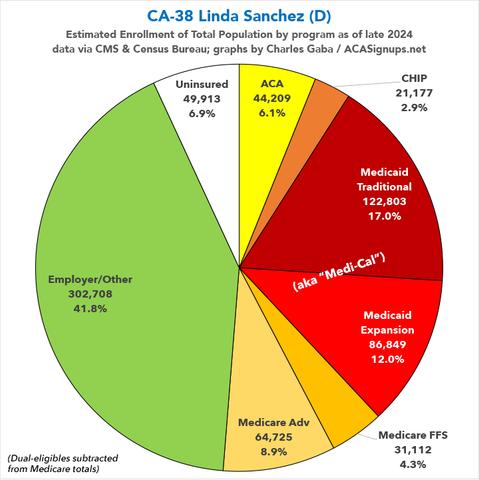
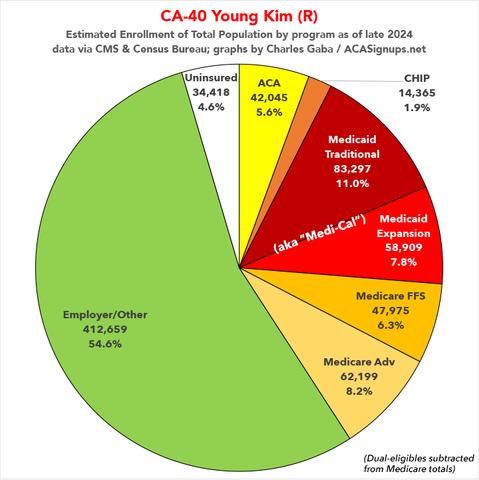
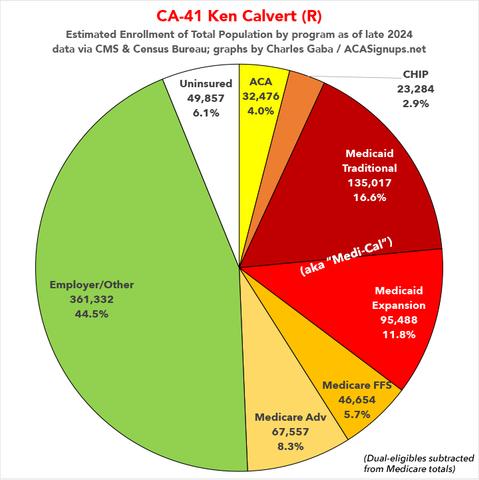
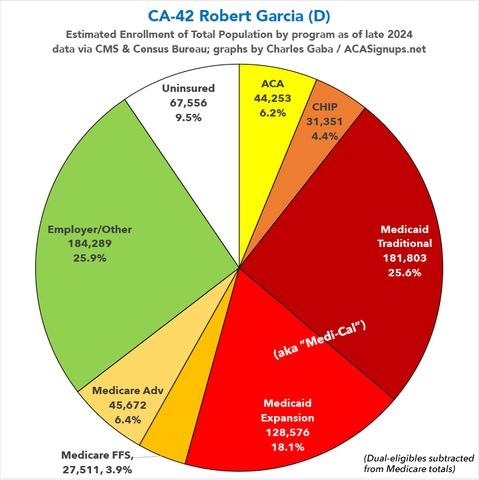
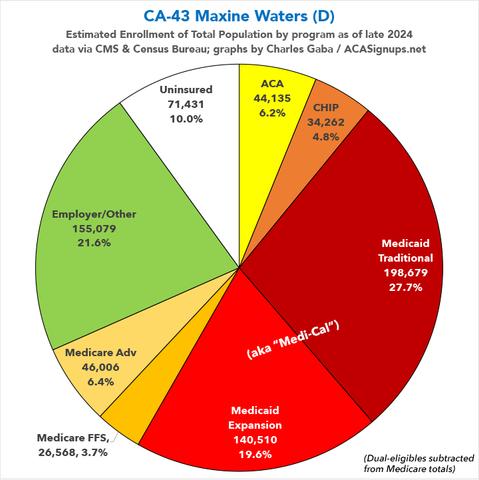
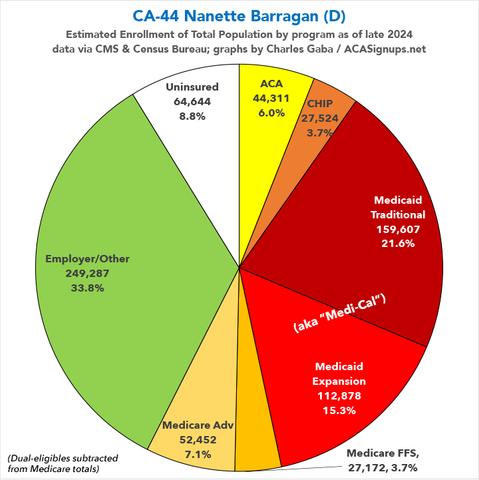
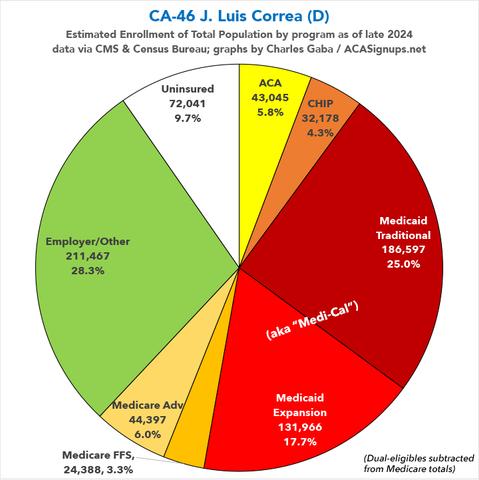
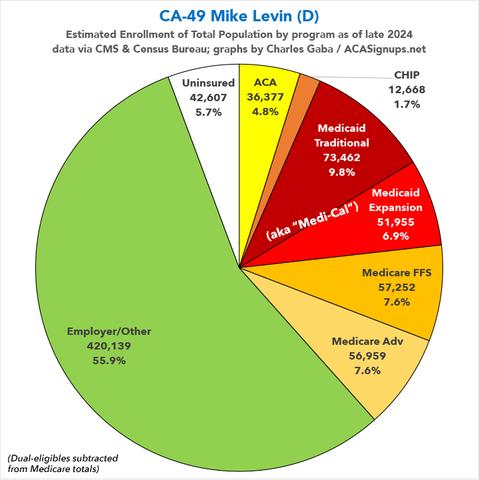
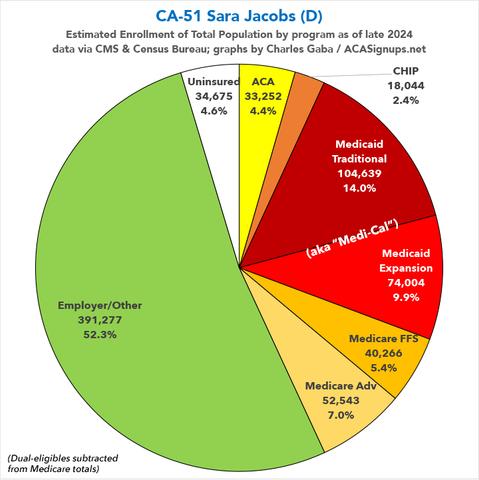
NOTE: This is a work in progress. Check back soon as I'm adding more states every day. Over the past couple of months I've compiled a master spreadsheet breaking out enrollment in ACA plans (Qualified Health Plans & Basic Health Plans), Medicaid/CHIP coverage (both traditional & via ACA expansion) and Medicare (both Fee-for-Services & Advantage) at the Congressional District levels. As noted in the methodology for each, there's a small amount of fuzziness in some of the numbers for a couple of reasons, the main one being that the "as of" date varies depending on the type of coverage--Medicaid/CHIP total numbers are as of last October, while ACA Expansion Medicaid is as of last June; Medicare data is as of September 2024; and ACA exchange QHPs/BHPs are as of January 2025. With that in mind, and with the pending dire threat to several of these programs (primarily Medicaid & the ACA) from the House Republican Budget Proposal which passed yesterday, I'm going a step further and am generating pie charts which visualize just how much of every Congressional District's total population is at risk of losing healthcare coverage. USE THE DROP-DOWN MENU ABOVE TO FIND YOUR STATE & DISTRICT.
Both #MAINE districts now available:
bsky.app/profile/char...
RE: https://bsky.app/profile/did:plc:kd4cyu4rpkgjbym3gckhrivz/post/3ljut7bs4rk2q
RE: https://bsky.app/profile/did:plc:kd4cyu4rpkgjbym3gckhrivz/post/3ljut7bs4rk2q
All 8 #MARYLAND districts now available
(as noted, I've also started breaking out Medicare/Medicaid *dual-enrollees* as well!)
bsky.app/profile/char...
RE: https://bsky.app/profile/did:plc:kd4cyu4rpkgjbym3gckhrivz/post/3ljvbodpfp22a
RE: https://bsky.app/profile/did:plc:kd4cyu4rpkgjbym3gckhrivz/post/3ljvbodpfp22a