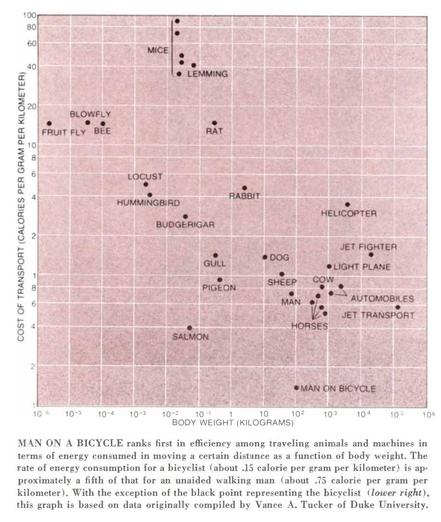
A person on a bicycle is by far the most energy-efficient among animals and machines per distance traveled relative to body weight. The bicycle is magic.
A person on a bicycle is by far the most energy-efficient among animals and machines per distance traveled relative to body weight. The bicycle is magic.
@pikarl @davidho in practice the energy use is still non-negligible and should be accounted for in planning. Especially the energy should be derived from plant matter...
https://www.nature.com/articles/s41598-020-66170-y
Bicycle is still a magical invention!

Reducing motorized transport and increasing active transport (i.e. transport by walking, cycling and other active modes) may reduce greenhouse gas (GHG) emissions and improve health. But, active modes of transport are not zero emitters. We aimed to quantify GHG emissions from food production required to fuel extra physical activity for walking and cycling. We estimate the emissions (in kgCO2e) per kilometre travelled for walking and cycling from energy intake required to compensate for increased energy expenditure, and data on food-related GHG emissions. We assume that persons who shift from passive modes of transport (e.g. driving) have increased energy expenditure that may be compensated with increased food consumption. The GHG emissions associated with food intake required to fuel a kilometre of walking range between 0.05 kgCO2e/km in the least economically developed countries to 0.26 kgCO2e/km in the most economically developed countries. Emissions for cycling are approximately half those of walking. Emissions from food required for walking and cycling are not negligible in economically developed countries which have high dietary-related emissions. There is high uncertainty about the actual emissions associated with walking and cycling, and high variability based on country economic development. Our study highlights the need to consider emissions from other sectors when estimating net-emissions impacts from transport interventions.
@mstengel that's the interesting question which I do not see in this paper. I'd expect fertilizers or diesel for tractors indeed being fossil fuels which end up in the atmosphere (as CO2 or laughing gas). Same for direct emission from farm animals (especially methane). Indirectly also from pasture plants on areas of former rainforrests or swamp land which has an "emissions tag" into the atmosphere. 1/2
Of course non-animal nutrition might nullify this. But for an average western meat-based nutrition it seems to me that "biking 2000km a year" vs. "making a long-range flight" can be equivalent for the climate.
Correct me, please. 2/2
@pikarl @mstengel @davidho the range of uncertainty is very large, but if you eat half of all that locomotive energy extra in UK or Australian diet...
This serves mostly to highlight the cost of even one flight, and our dietary choices, though.
Cycling all year around is still magical in every other respect.
@janvenetor @pikarl @mstengel @davidho
Personal anecdotal evidence for #eBike more efficient than pedal-alone: regular 40km shopping trip on eBike often undertaken without /much/ extra food, indeed often set off with just coffee.
However, motor [gear] failure half-way to the collection resulted in return from the breakdown place - a long slow mountainous pedal home. Over the next few hours, I ate about 3 extra energy-rich meals before my hunger was satisfied, at least a normal day's /extra/ food!
The eBike typically consumes about 1 kW.hr on the return trip. Load complicates potential calc, of course.
@lydiafacts thanks. Certainly the "magic parts" of cycling are true, like physical wellbeing etc.
But for the agriculture there are critical ressources in use which are not all fuels but certainly fossil. Like phosphorous which is mined. And like nitrogen which is mostly produced via the Haber Bosch process using "natural" (fossil) gas.
Those are not at all reasons to stop cycling but to think of sustainable living with a systems view.
A person on a bicycle is by far the most energy-efficient among animals and machines per distance traveled relative to body weight. The bicycle is magic.
@davidho I don’t think that chart accounts for the energy cost of building the roads over which we ride our bicycles. We can’t easily cycle of sand, grass, or mud. We at least need gravel, and probably concrete. And concrete is one of the most carbon-intensive materials to make.
Once that initial energy cost is paid, that cost can be divided across many individual cyclists and divided across many years of use. The more people who use the road, and the longer they use it, the lower the total energy cost per individual. This just goes to show how important good city planning is for reducing our carbon footprint.
@jaseg @pikarl @janvenetor @davidho
found out where?
The provenance of the data is important in todays world.
@jaseg @pikarl @janvenetor @davidho
I guess it's a good analogy, but it wouldn't work for anyone who happens to not be concurrently considering exactly those two life choices. 😃
I would like the chart-makers to recalculate the data factoring in the energy needed to make roads and runways in those instances where they apply. The bicycles would maybe need half the roadway of cars, but still.
We hold up the wheel as civilization-defining technology, but wheels are for naught without roads, and the smoother, the better.
@patrickgillam @davidho indeed. In Europe we marvel at the remaining roman buildings, but all the roads they built are covered by our own, newer, smoother, layers upon the ones they built back then, building roads across half the continent might have been one of their most impactful work.
(no, i don’t commonly think about the roman empire)
@patrickgillam @tshirtman @davidho
Yeah, this. I'd be interested to see the same comparison across different types of terrain.
Presumably, salmon are much less performant on roadways. And grass. And mountains.
Bikes also probably rather poor in the ocean.
What of the xturismo drone bike I wonder?
What about cheetahs?
Chart from 1973
Very hard to understand this chart → what is this ordinate scale ?
Salmon weight → between 10g and 100g
Rat weight → between 100g and 1kg
Salmon < rat
WTF ?
Difficult to trust the data
Here's an idea: Salmon powered cars.