Today I will be tooting about the Historical Network Research Conference #HNR2024, day 2. https://historicalnetworkresearch.github.io/lausanne/program/
@GrandjeanMartin opens the day. He has been using a network to make the program and find which papers go best together. #hnr2024
Custom-made versions of that network, more friendly.
🌈 Note: the rainbow colors arise from my camera interacting weirdly with the projection! Be reassured that Martin's slides are very monochromatically serious.
@martenduering narrates how he came to believe that would be possible to work with networks in history.
A key paper for him was this one by Claire Lemercier:
Formal network methods in history: why and how?
https://shs.hal.science/halshs-00521527v2/document
"My hope is that it stays open and loosely defined."
@martenduering about the field in general, and in particular the HNR community spaces like the Journal of Historical Network Research (JHNR).
https://jhnr.net/
@martenduering about the field in general, and in particular the HNR community spaces like the Journal of Historical Network Research (JHNR).
https://jhnr.net/
HNR personas according to @martenduering :
* The historian
* The historical sociologist
* The computer scientist
* The network scientist
* The multi-talents
"You have guessed that we need all of them."
#hnr2024
A key insight from Marten: a very important part of the HNR community consists of historians, and more precisely people who do not define themselves as *digital* humanists or *digital* historians but just historians, and who need networks to get the job done.
The digital/computational is not necessarily a career path, it sometimes comes to you whether you want it or not, and it does not define you even if you embrace it for a time.
@lucasrappo presents his work about the land market in Lausanne in the 19th century.
Source: two cadastral maps, from 1931 and 1888, that he datafied.
By comparing them, he can identify where the city expanded.
From there, he could go back to the register of the land plots, and obtain a network of who sold which land to whom in the areas where the city expanded.
For one of the two areas where the city expanded, the story told by the data, says @lucasrappo, is that of families of local elites and older generations passing their belongings on to new generations, with not much involvement of the city of Lausanne itself.
For the other area where the city expanded, the story is different. A key actor emerges, an engineer and entrepreneur, who was probably engaging in financial speculation, as his node centrality in the financial market network suggests.
The question is: what do people do with the land plots? Do they keep them, sell them? Why do they split the land plots? What is their motivation? The network is an entry point into inquiring further about those persons and the land plots themselves.
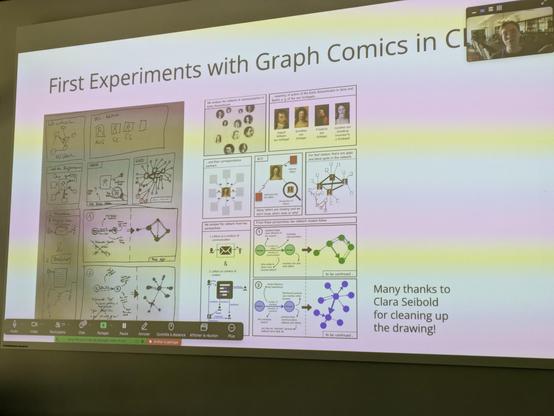
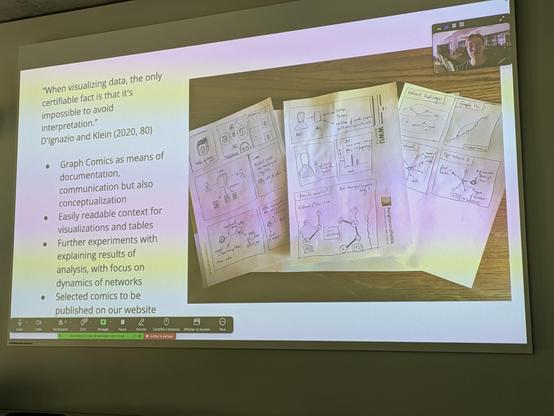
Now Elena Suárez Cronauer and Aline Deicke tell us about how they used graph comics to explore communication networks. Very exciting!
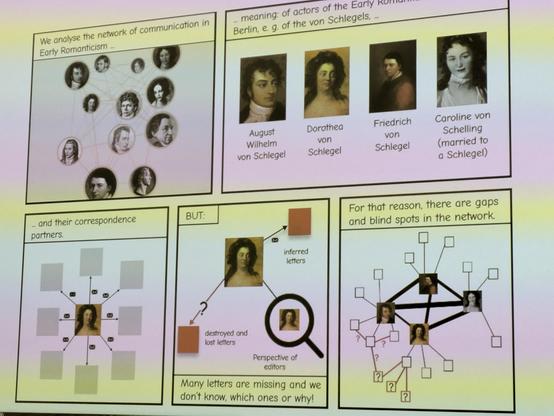
The question is: what is the dynamic within a group of authors sending letters to each other? The goal is to better understand early romanticism.
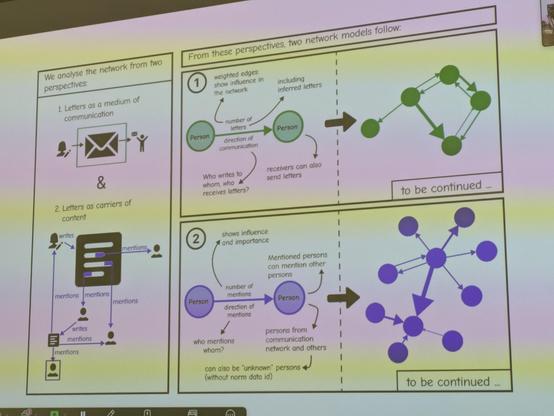
And it all starts with a knowledge graph in Neo4J, which you can see below. 💪
From there you can make different network visualizations such as those you can see below: who sends a letter to whom; who mentions whom...
But it is difficult to communicate about the work by using these visualizations, because it lacks context. It's Haraway's "god trick" once again.
Graph comics is a solution to this issue.
Graph comics is a technique developed by Benjamin Bach.
https://aviz.fr/~bbach/graphcomics/
You have probably seen that paper, but we don't see an actual application that often. It's not easy to do!
You can see their process in those images. It is iterative, and largely manual.
Elena and Aline frame it as a matter of data feminism (following Catherine D’Ignazio and Lauren F. Klein).
Next up is Gert Huskens with a network about "elite formation in urban Egypt" at the end of 19th century.
Elites evolve quickly due to the everchanging colonial forces in Egypt (French, British...) + an autochthonous elite + an (agro-)capitalist boom.
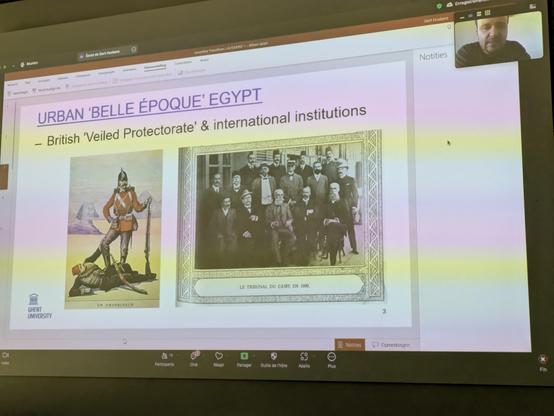
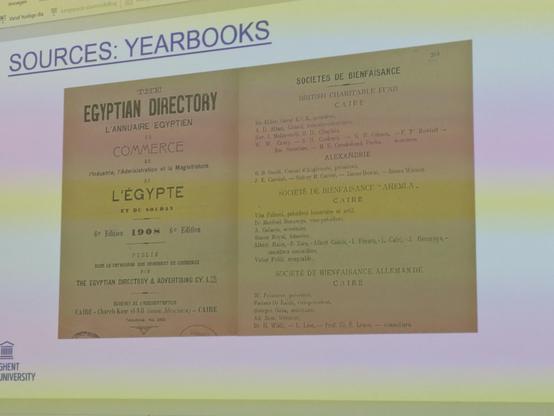
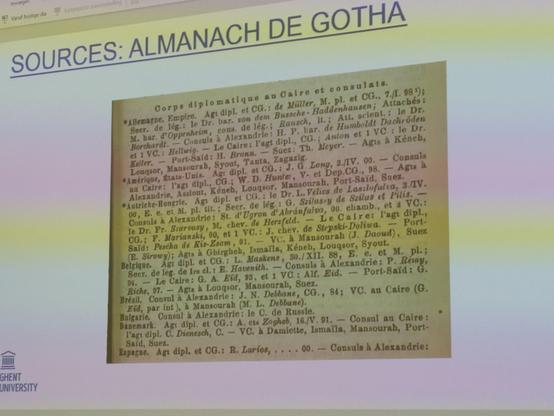
Gert looks into yearbooks, almanachs, and "livres d'or" where one can find a lot of information about elites: who gets which position, who contributes to which charity, etc.
Gert and his co-authors draw inspiration from contemporary elite studies using network analysis, e.g. Christoph Ellersgaard's work.
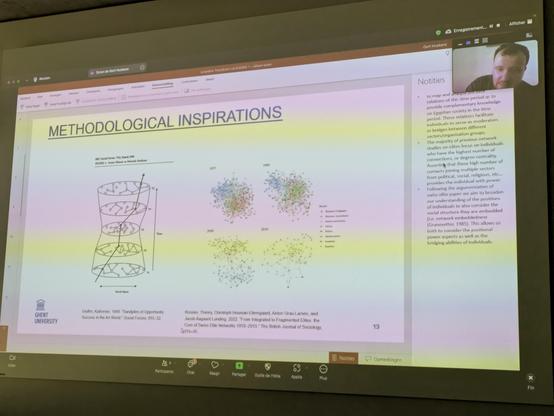
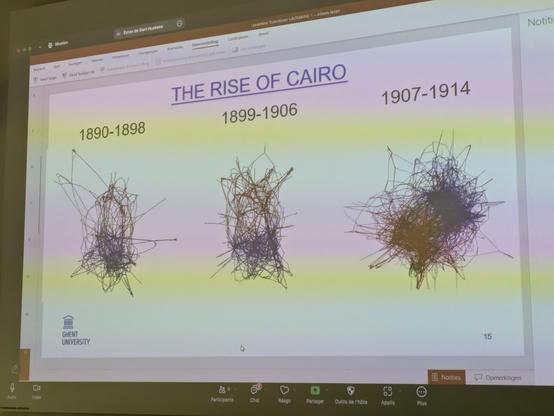
In this slides you can see the evolution of the elite network over the years.
The elites are defined by two hubs, Cairo and Alexandria. Diplomats are bridging them.
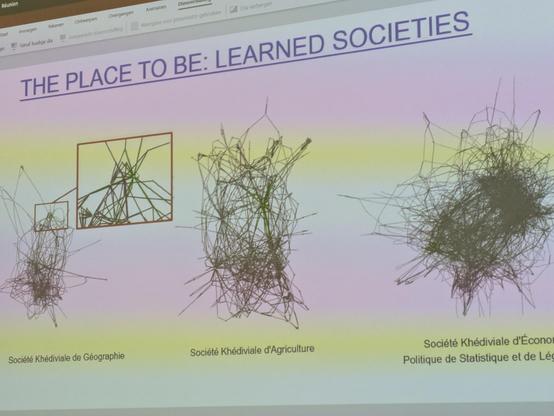
Gert is using his network maps as platforms to dive deeper into the data, and get qualitative when needed.
His inquiry is largely quali, even though the network is used as a narrative red thread in his presentation. Sometimes, it entails zooming on a detail because that's what the research demands.
So what do we learn?
* The organizations organize into a hierarchy
* The capitalist boom is the main shaping force of the elites
* The Cairo hub is gradually taking over
I'm back to tooting about historical network research, still with rainbow moiré pictures 🌈.
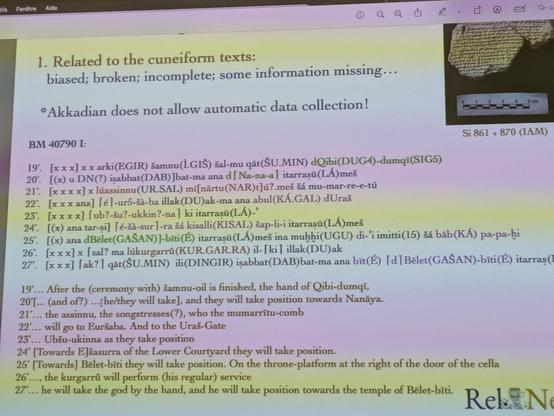
Late Babylonian period. People have tablets (clay, not Apple). They have religion. Can we learn about it by building networks? Rocio Da Riva tells us about it.
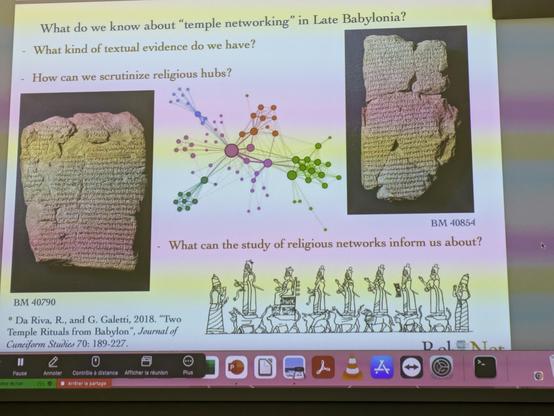
Religious movements are elements of social cohesion and express political goals. We can make networks to understand various things, such as which sanctuary is sponsored by royalty etc.
She's still at the beginning of her work but I'm curious about the result.
Rocio studies 150 cuneiform texts. If you wonder what that looks like once transcribed, check it out:
Tayla Newland presents a "narrative network analysis" where she can emphasize relations between agents and objects (rather than focusing on putting them into separate boxes).
She studies fibulae, popular ornaments people used in the South of Italy in the 8th century, that we archeologists find where people were buried.
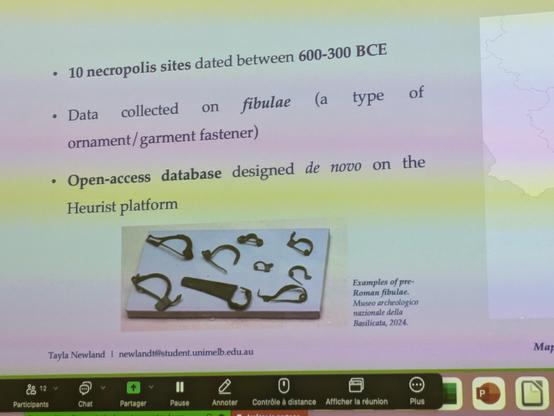
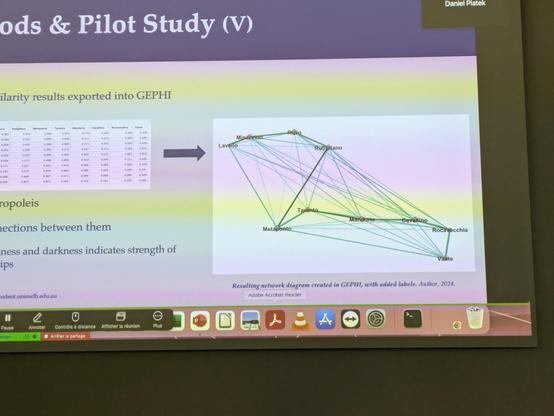
Here is an example of what Tayla was able to produce. The nodes are burial sites placed according to their geolocation. The connections are the similarities in the fibulae found there. Work in progress!
#hnr2024
#hnr2024
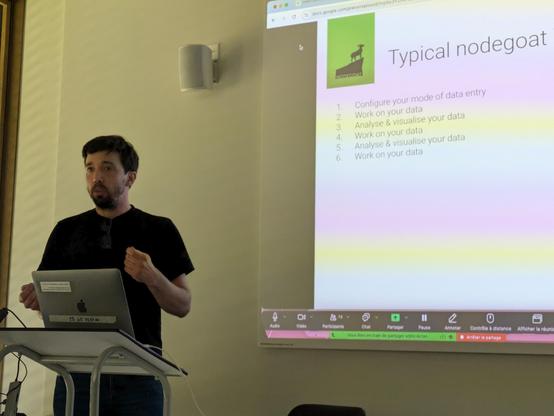
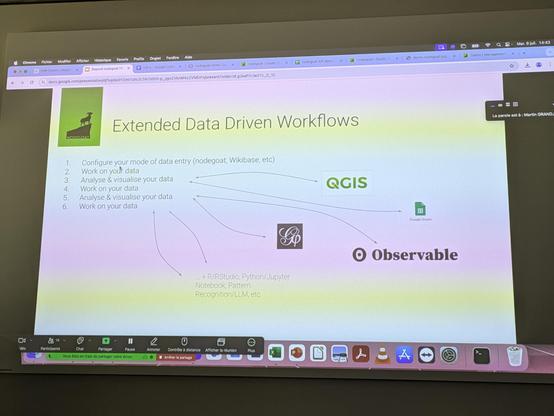
Next up is Geert Kessels from @lab1100 (with Pim van Bree), creators of Nodegoat, the open source tool to analyze relational and temporal data.
https://nodegoat.net/
It's online-based, embeds a rich database system, does geolocated and force-driven visualizations, and always integrates the time dimension gracefully.
Geert and Pim told me yesterday that their tool has been inspired by Bruno Latour and Actor-Network Theory; I think he would be happy about it.

nodegoat
nodegoat is a web-based data management, network analysis & visualisation environment. Using nodegoat, you can create and manage any number of datasets by use of a graphic user interface. Your own data model autoconfigures the backbone of nodegoat's core functionalities. Within nodegoat you are able to instantly analyse and visualise datasets. nodegoat allows you to enrich data with relational, geographical and temporal attributes. Therefore, the modes of analysis are inherently diachronic and ready-to-use for interactive maps and extensive trailblazing.
Nodegoat exports to GIS software, Gephi, Observable... Your data is not stuck within the tool.
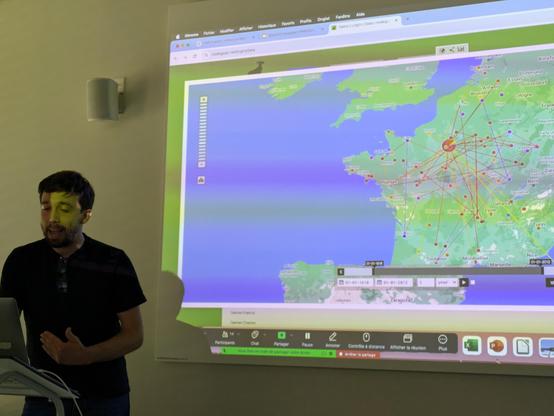
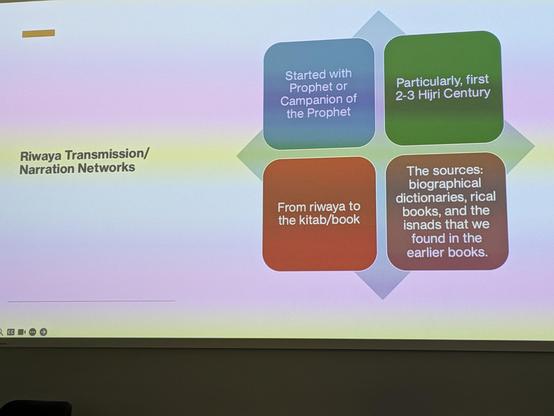
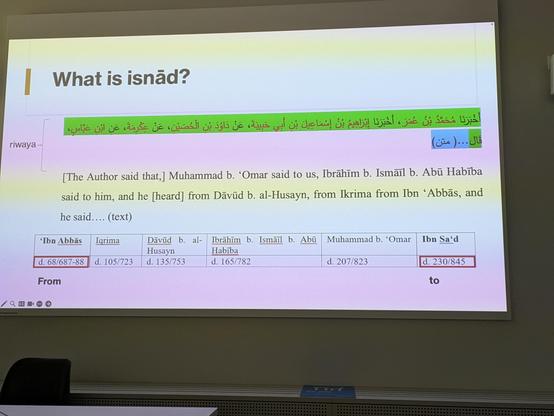
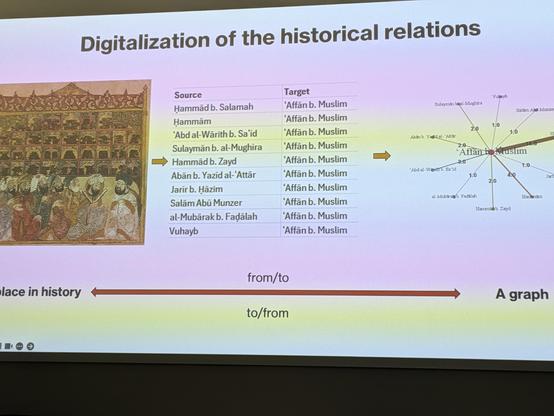
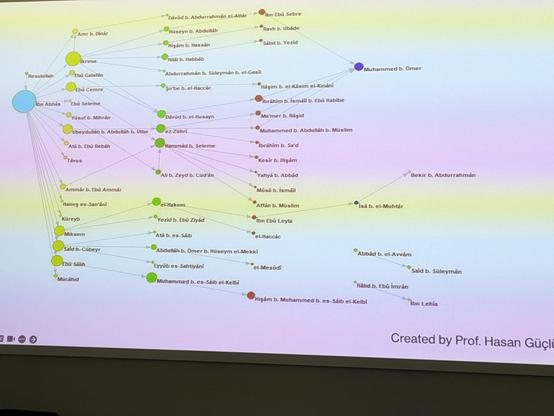
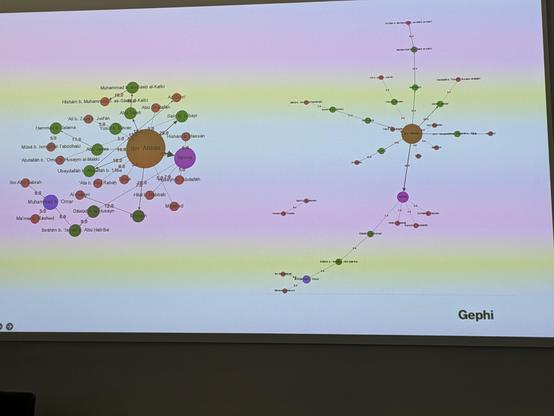
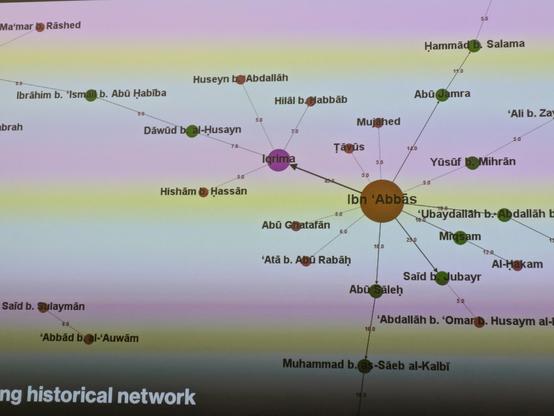
Tuba Nur Saraçoğlu visualizes early Islamicate scholars' networks.
Those are narration networks, transmission chains from one actor (ex: the Prophet) to others, until a final inscription in a document. We can track the chains in historical records.
Tuba has been experimenting a lot. She started with Pajek, but the layouts did not work for her at first...
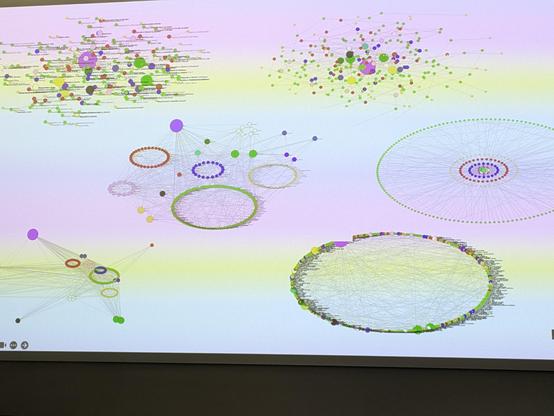
...although with some help, she could visualize the time dimension that so important in her data.
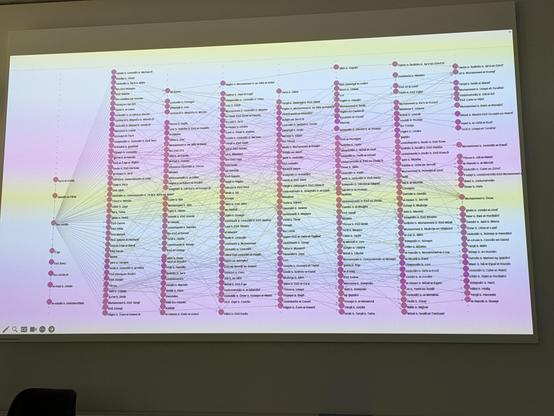
She found the layouts in Gephi more natural to her, but the time dimension is still not easy to visualize. Tuba is still experimenting to find what suits her best.
#hnr2024
#hnr2024
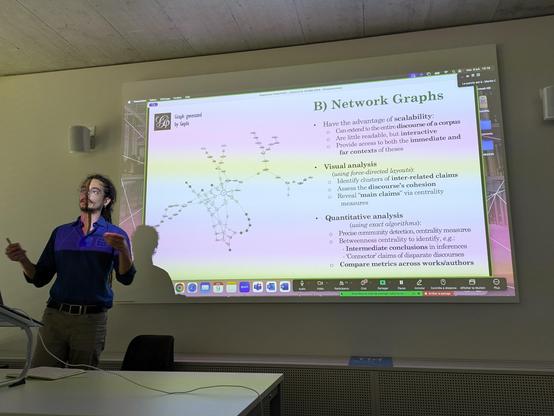
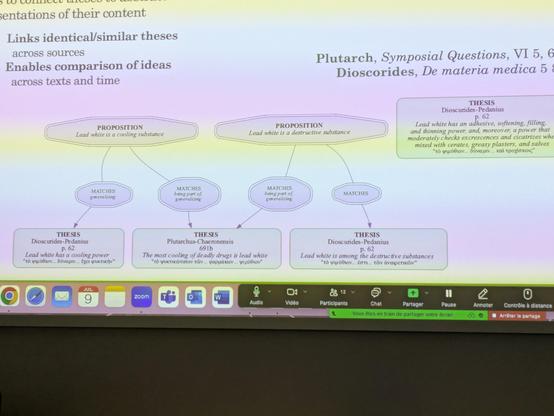
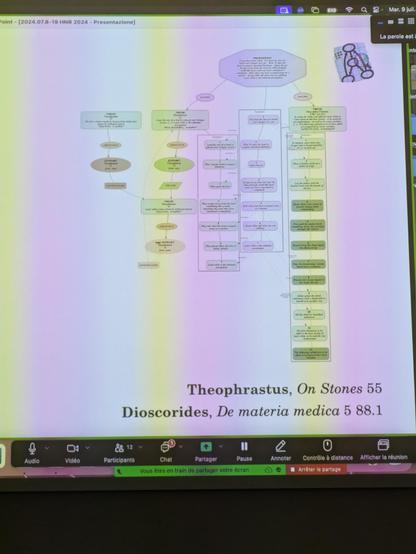
Daniele Morrone is representing discourses as networks, two different ways.
First kind: argument maps. Links between arguments and conclusions in discourses.
Two examples below, a simple one and a rich one. This network is a diagram generated with GraphViz.
The second kind is network maps, Gephi-style.
It's a different trade-off in terms of method; it comes with its own challenges and opportunities.
Daniele explains that the network map we see below has flaws. We see long chains of nodes: those have "pseudo-nodes" that are artefacts of the method.
Lesson learned: Daniele can now make better decisions when building his networks. Visualization supports reflexivity.