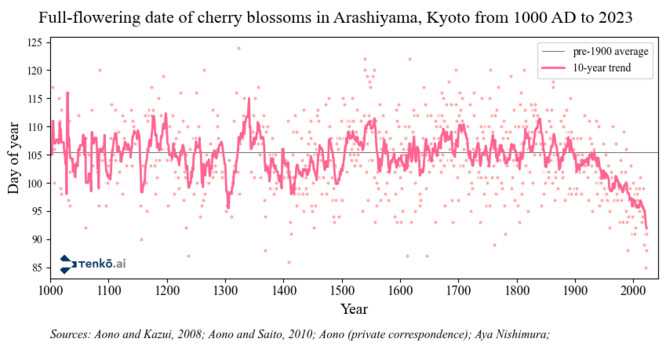
A striking visualisation of #climatechange: the date of Kyoto cherry blossoms' reaching full bloom, plotted over the past 1000 years.

Thanks to the cultural significance of cherry blossoms in Japan, we have data on the specific day of the year when a very particular species of cherry blossom (P. jamasakura) reached "full-flowering" (満開) in a specific area on the outskirts of Kyoto (Arashiyama), all the way back to 800 AD.

The trend of the past 50 years is hard to miss…

Most of the data was painstakingly collected and analysed by Prof. Aono and his collaborators: http://atmenv.envi.osakafu-u.ac.jp/aono/kyophenotemp4/

The full-bloom date for 2023 (yesterday: the 29th), was confirmed by local resident and friend, Aya. (bc the data refers to a very specific species and location, they do not match official JMA reports)

Webサイト公開終了のお知らせ:生態気象学研究グループ

Webサイト公開終了のお知らせ

Robin Rohwer

Mom asked, "I wonder when cherries bloom in Japan?" So I found 1200 years of data online and made her a plot.

@deivudesu i no longer want to frame it as some sort of debate about if it’s real, I want to frame it as the rich not caring about the world and refusing to change their ways because of profit
@reconbot @deivudesu We should all frame it that way. It is, after all, the truth.
@deivudesu so much different data shows the same trend :(
@deivudesu Hard to ignore that the data drops off the cliff right around 1945...
@deivudesu I live near Branch Brook Park Newark NJ which has the largest collection of cherry blossom trees in the US. The young trees were blooming in February as we did not really have a winter here this year. The older trees, I notice, do wait until about April to bloom.
@deivudesu there appears to be much less variance during the later datapoints. What would explain that?
@deivudesu This is a striking illustration of the importance of recording primary data. It's hard to argue against a thousand year old trend.
@deivudesu
As I'm sure you know, but some readers may not,
this is an example of a *phenology* record. In his classic Paleoclimatology - Reconstructing Climates of the Quaternary (3rd Ed, 2015),
pp.534-538 covers phenological&biological records.
p.535 discusses Kyoto and others:
Tidbit: Wegman Report(2006) copied a table from Ray's 2nd edition(1999), misspelling phenology as phonology.
Paleoclimatologists would certainly use millenium-old sound recordings if they existed, but they don't.
@deivudesu is there a publication?
@deivudesu is the graphic CC by or CC by-sa licensed? I’d love to spread it more!
@deivudesu @DaNanner you get a similar result looking at days of frozen ice on lakes in the Midwest
@deivudesu
It is the prettiest climate hockey stick, even if it's just as scary as the other ones.
@deivudesu FWIW, the cherries in Washington, DC bloomed weeks ahead of schedule this year.
@deivudesu does this trend match with other known phenomenon such as temperature changes? From memory it seems the Cherry blossoms react quite quickly to CO2 emissions?
@deivudesu now you can also draw the coefficient of variation as a graph and you get data telling you not only the trend but also whether it's varying more.
@deivudesu An interesting trend in cherry blossoms. What's the next step to hypothesize and then test for causal factors?
@deivudesu why are the lower datapoints around 1500, 1150, 1380, 1400, 1600, 1640, 1750 disregarded as outliers? Asking for a friend.