@JGeoSys
a couple weeks ago. Quick thread:
Paper🔖 https://link.springer.com/article/10.1007/s10109-022-00400-x
🔓PDF https://urbandemographics.org/publication/2022_jgs_time_geography_gtfs2gps/
R package📦 https://ipeagit.github.io/gtfs2gps/

Exploring the time geography of public transport networks with the gtfs2gps package - Journal of Geographical Systems
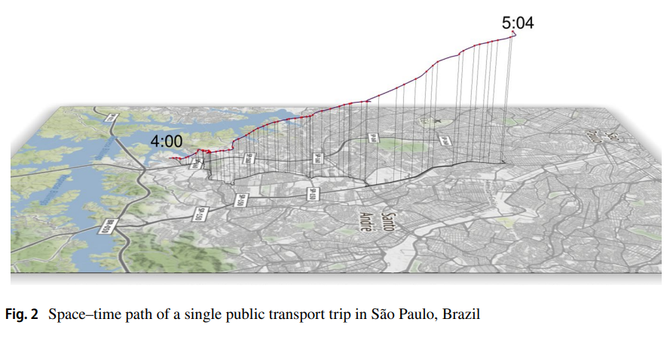
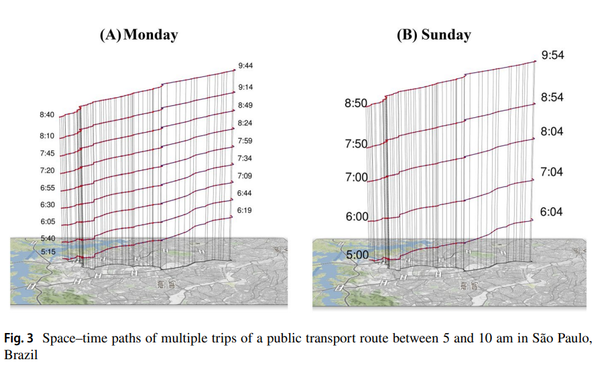
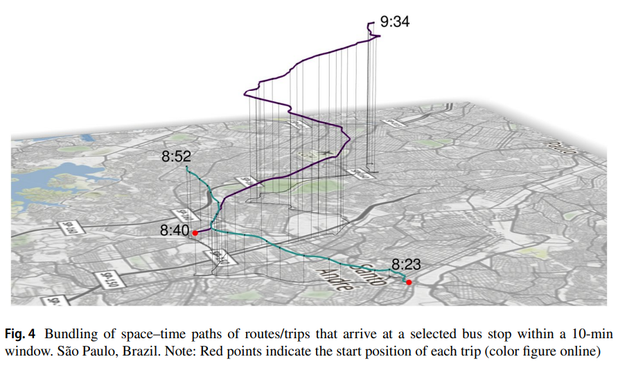
The creation of the General Transit Feed Specification (GTFS) in the mid-2000s provided a new data format for cities to organize and share digital information on their public transport systems. GTFS feeds store geolocated data on public transport networks, including information on routes, stops, timetables, and service levels. The GTFS standard is now widely adopted by thousands of transport authorities and a wide variety of software applications for different purposes, including trip planning, timetable creation and accessibility analysis. Yet, there is still a lack of tools to parse GTFS data when the objective is to analyze the complex spatial and temporal patterns of public transport systems. This paper presents {gtfs2gps}, a new general-purpose computational tool to easily process static GTFS data that allows one to analyze the space–time trajectories of public transport vehicles at fine spatial and temporal resolutions. {gtfs2gps} is an open-source R package that employs parallel computing to convert GTFS feeds from relational text files into a trajectory data table, similar to GPS records, with the timestamps of vehicles in every trip. This paper explains the package functionalities and demonstrates how {gtfs2gps} can be used to articulate key concepts in time geography to explore and visualize the spatial and temporal patterns of public transport networks. We also present a case study looking at how {gtfs2gps} can be used to examine socioeconomic and spatial–temporal inequalities in access to public transport, providing key information to monitor cities’ progress toward the Sustainable Development Goals. The paper is accompanied by a computational notebook in R Markdown to support reproducibility of the results in this paper and to replicate the analysis for other contexts where GTFS data are available. Given the widespread use of GTFS, {gtfs2gps} opens new possibilities for researchers to examine the time geography of public transport systems in urban areas across the globe.