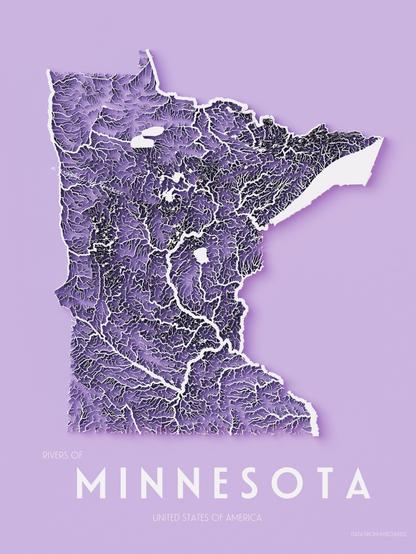
Rivers of Minnesota.
#rayshader adventures, an #rstats tale
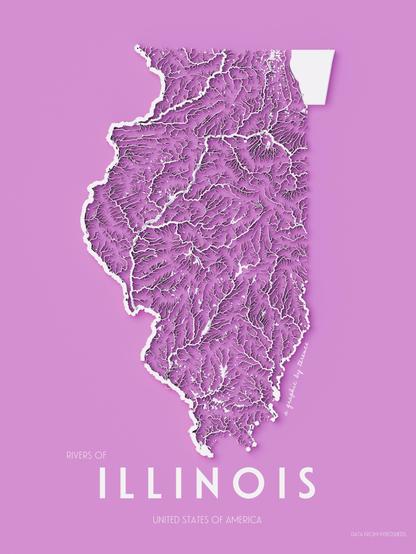
Rivers of Illinois.
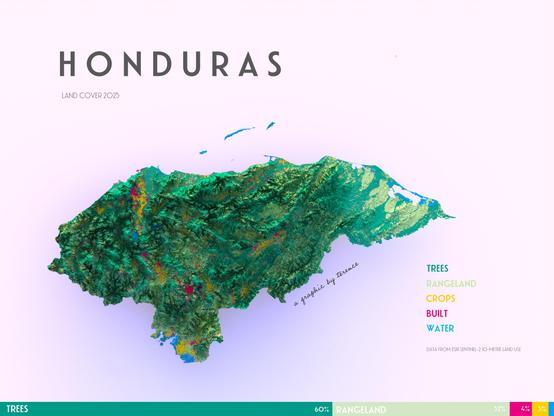
Land cover of Honduras.
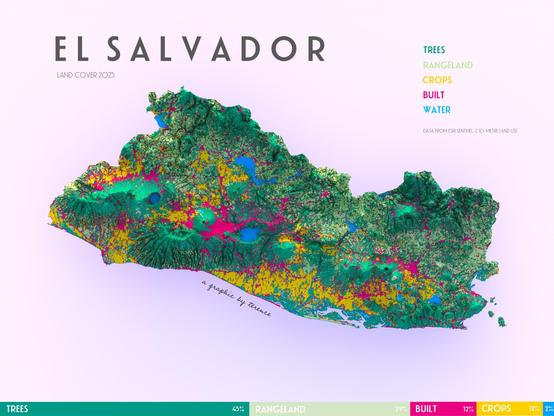
Land cover of El Salvador.
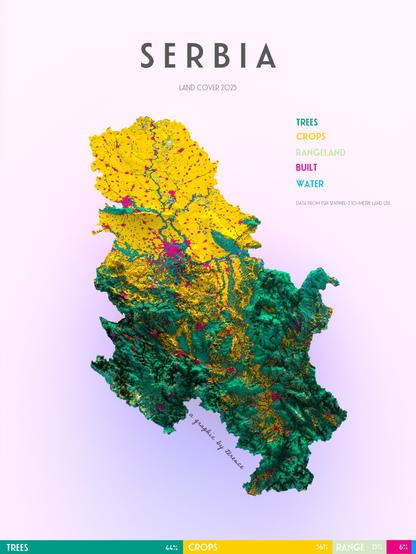
Land cover of Serbia.
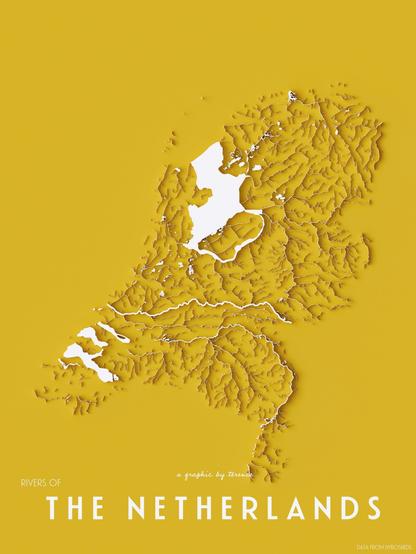
Rivers and lakes of the Netherlands.
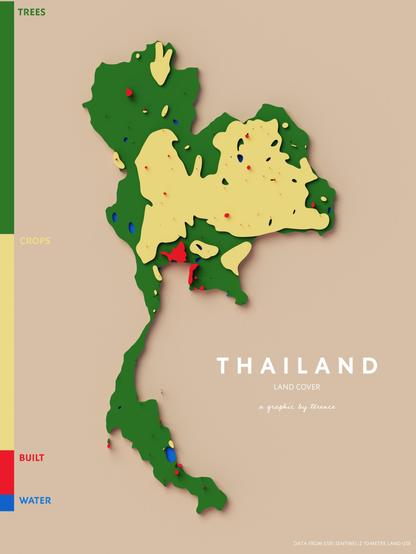
Land cover of Thailand.
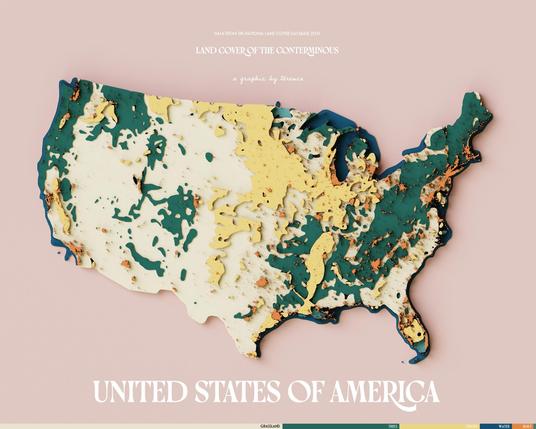
Land cover of the conterminous United States of America.
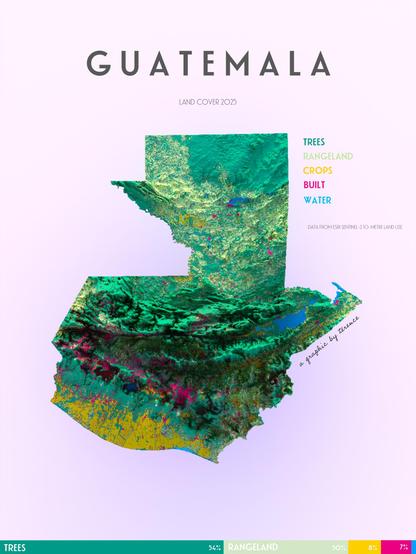
Land cover of Guatemala.
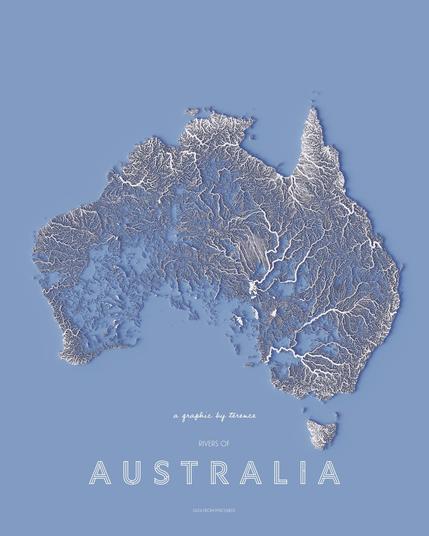
Rivers of Australia.